

Question: Can you help me solve this problem and show the procedure from the result given. 21. Construct and interpret a c chart using the following

Can you help me solve this problem and show the procedure from the result given.
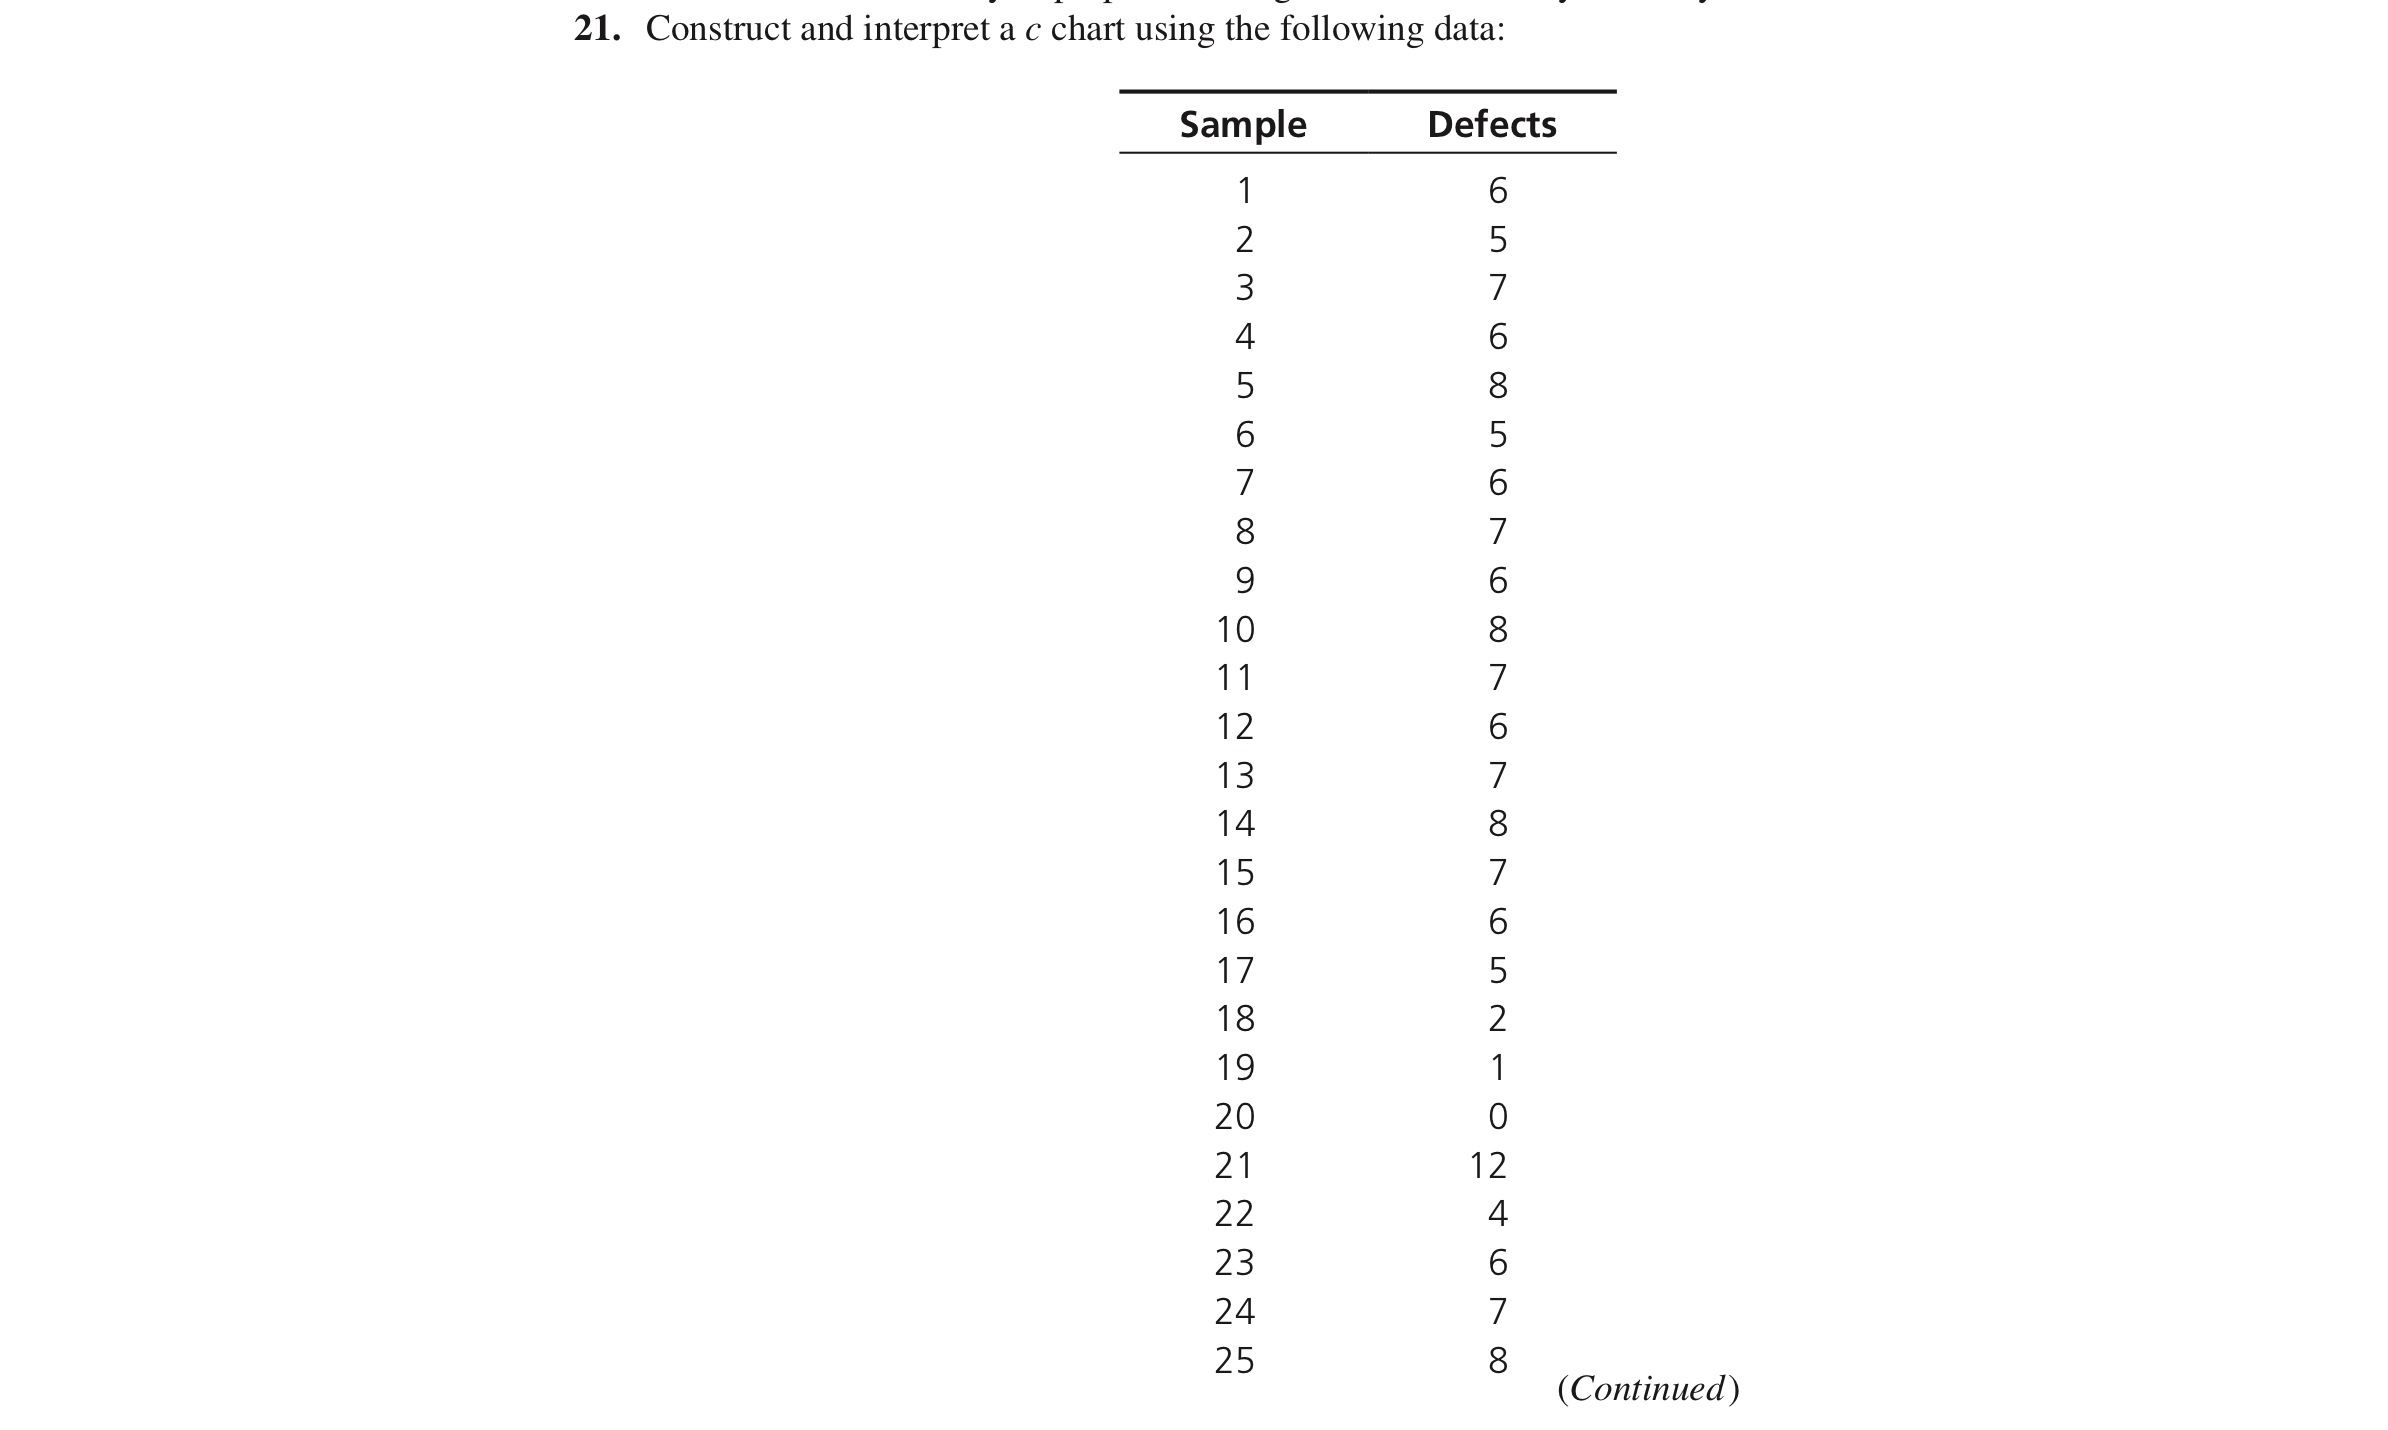
21. Construct and interpret a c chart using the following data: \begin{tabular}{cc} \hline Sample & Defects \\ \hline 26 & 3 \\ 27 & 2 \\ 28 & 3 \\ 29 & 2 \\ 30 & 3 \\ \hline \end{tabular}
Step by Step Solution
There are 3 Steps involved in it
1 Expert Approved Answer
Step: 1 Unlock

Question Has Been Solved by an Expert!
Get step-by-step solutions from verified subject matter experts
Step: 2 Unlock
Step: 3 Unlock