

Question: Can you help me to solve in matlab please si x2 +y2 > 4 Graph the function of 2 variables in the region limited by
Can you help me to solve in matlab please
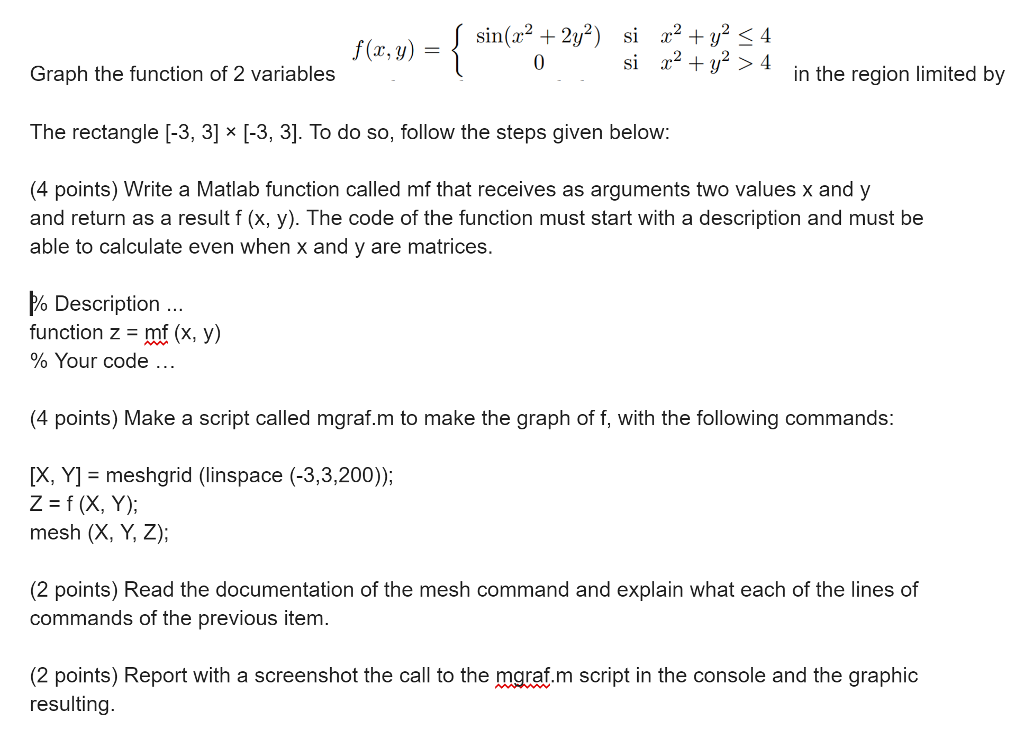
si x2 +y2 > 4 Graph the function of 2 variables in the region limited by The rectangle [-3, 3] x [-3, 3]. To do so, follow the steps given below (4 points) Write a Matlab function called mf that receives as arguments two values x and y and return as a result f (x, y). The code of the function must start with a description and must be able to calculate even when x and y are matrices % Description .. function z - mf (x, y) % Your code (4 points) Make a script called mgraf.m to make the graph of f, with the following commands: [X, Y]- meshgrid (linspace (-3,3,200)); Z-f (X, Y); mesh (X, Y, Z); (2 points) Read the documentation of the mesh command and explain what each of the lines of commands of the previous item (2 points) Report with a screenshot the call to the mgraf.m script in the console and the graphic resulting
Step by Step Solution
There are 3 Steps involved in it

Get step-by-step solutions from verified subject matter experts