

Question: can you help me to solve the problem 2.9 2.9. The following plots represent five different samples of data. For each, describe the shape. a.
can you help me to solve the problem 2.9
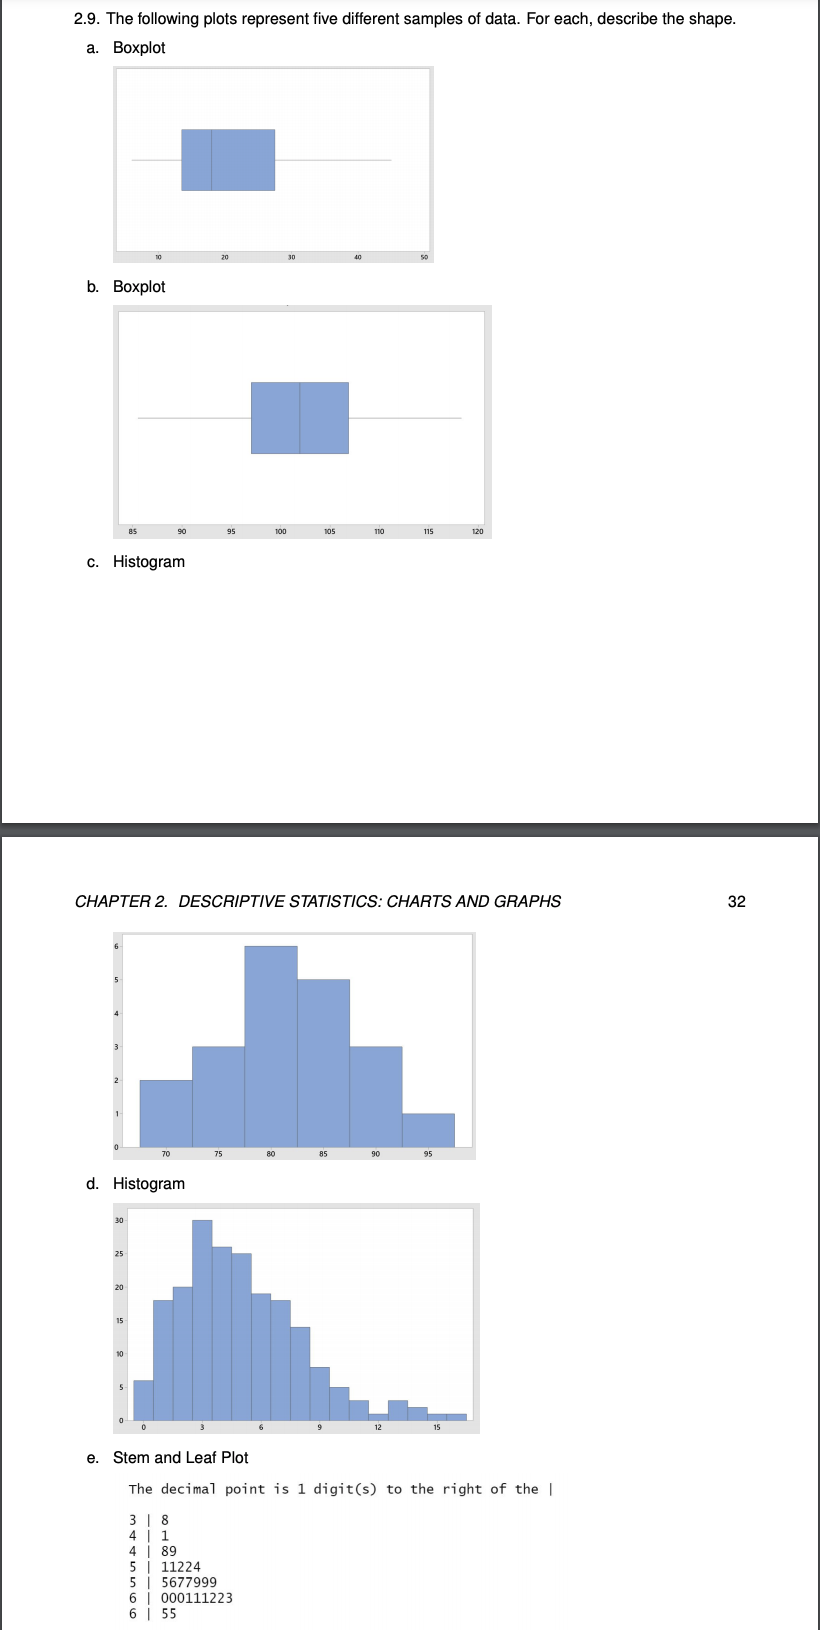
2.9. The following plots represent five different samples of data. For each, describe the shape. a. Boxplot 20 30 b. Boxplot 85 90 95 100 105 110 115 120 c. Histogram CHAPTER 2. DESCRIPTIVE STATISTICS: CHARTS AND GRAPHS 32 70 75 80 85 90 95 d. Histogram 25 20 15 10 12 15 e. Stem and Leaf Plot The decimal point is 1 digit(s) to the right of the | 3 8 1 89 11224 5677999 000111223 6 1 55
Step by Step Solution
There are 3 Steps involved in it
1 Expert Approved Answer
Step: 1 Unlock

Question Has Been Solved by an Expert!
Get step-by-step solutions from verified subject matter experts
Step: 2 Unlock
Step: 3 Unlock