

Question: Can you help me understand what is wrong with this figure? I am looking for a minimum of two things which can be corrected and
Can you help me understand what is wrong with this figure? I am looking for a minimum of two things which can be corrected and why or how?
i am simply to find two things which could be correct with the figure. im confused and have no idea what is wrong. scale, legend, etc
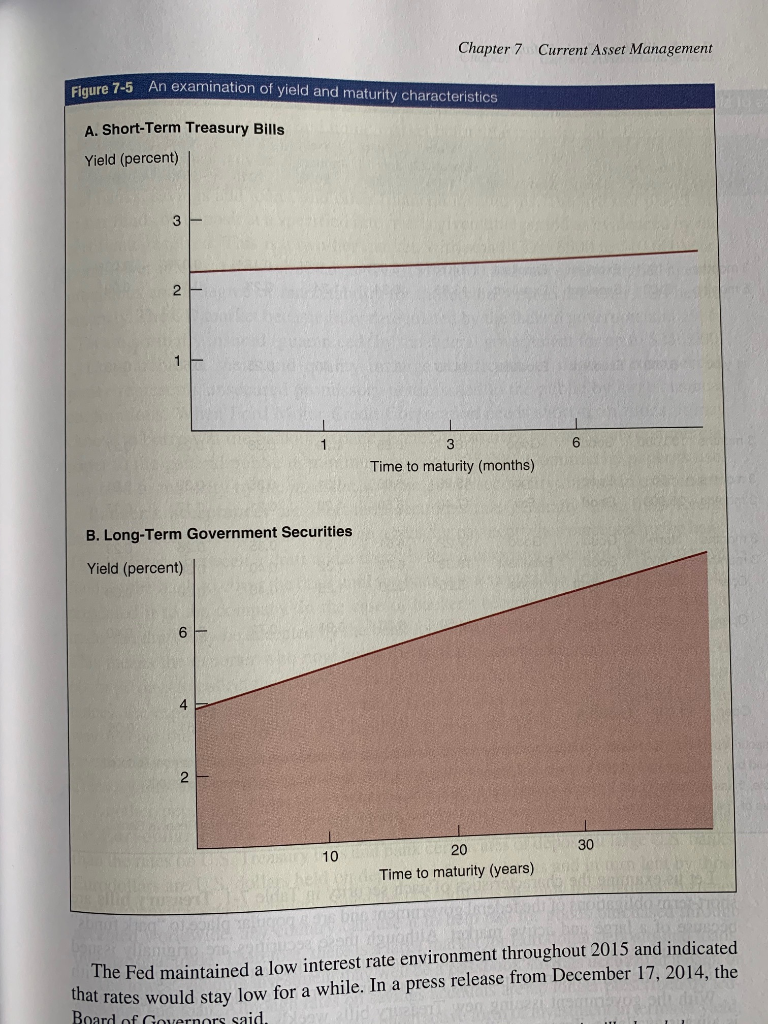
Chapter 7 Current Asset Management Figure 7-5 An examination of yield and maturity characteristics A. Short-Term Treasury Bills Yield (percent) 3 2 1 1 6 3 Time to maturity (months) B. Long-Term Government Securities Yield (percent) 6 4 2 30 10 20 Time to maturity (years) The Fed maintained a low interest rate environment throughout 2015 and indicated that rates would stay low for a while. In a press release from December 17, 2014, the Board of Governors said
Step by Step Solution
There are 3 Steps involved in it
1 Expert Approved Answer
Step: 1 Unlock

Question Has Been Solved by an Expert!
Get step-by-step solutions from verified subject matter experts
Step: 2 Unlock
Step: 3 Unlock