Question: Can you help me with Problem 2 on MAT330ModuleFiveTemplate.mlx? (The very last picture) I would also appreciate a picture of what the graph is supposed
Can you help me with Problem 2 on MAT330ModuleFiveTemplate.mlx? (The very last picture) I would also appreciate a picture of what the graph is supposed to look like on MATLAB so I can make sure it's right.
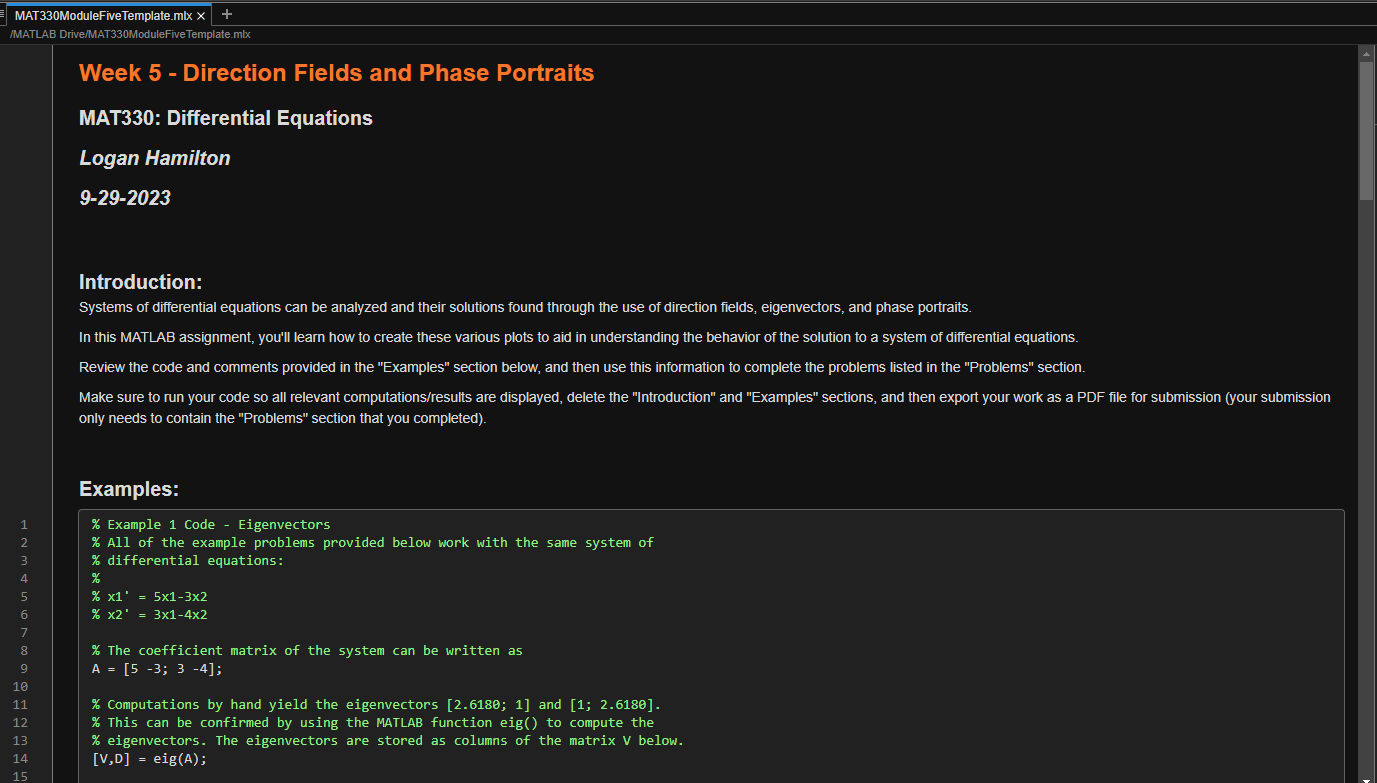
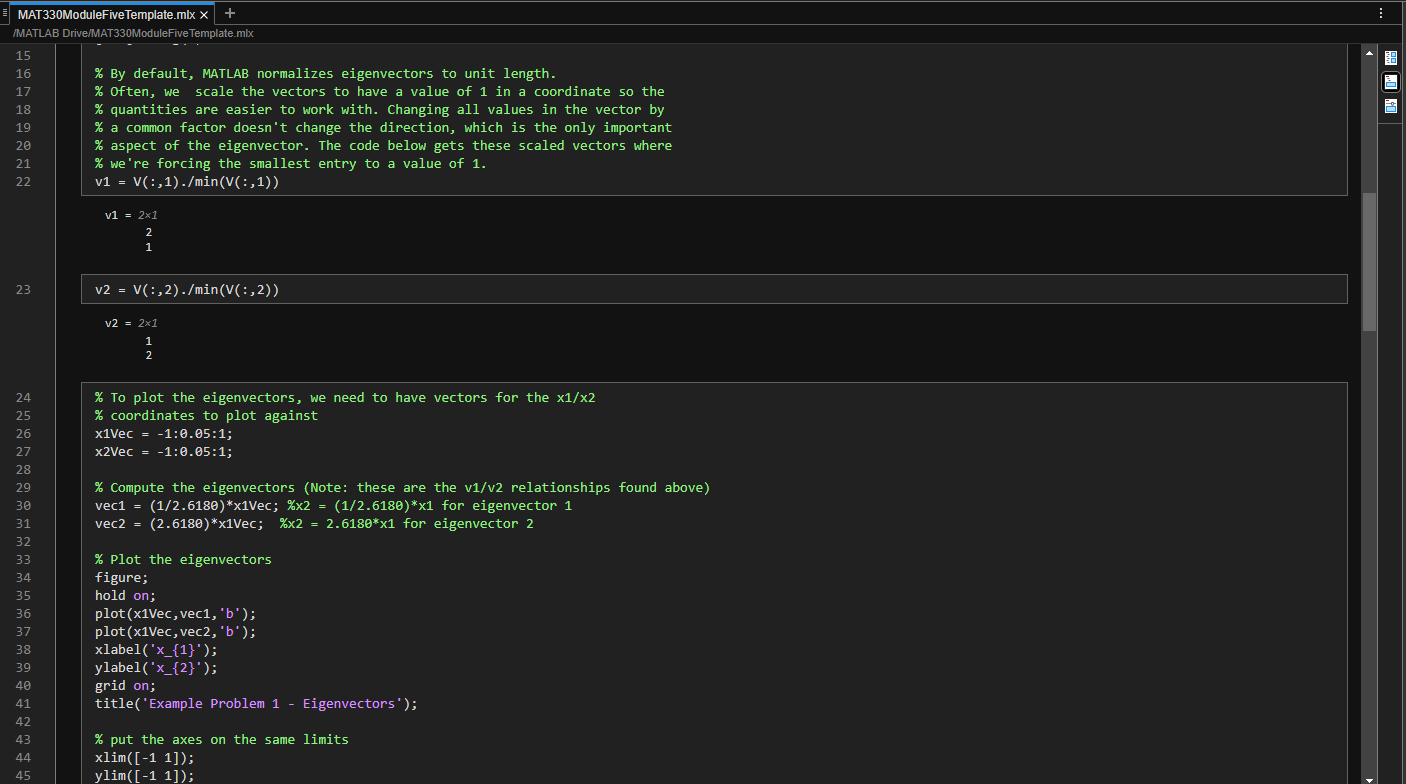
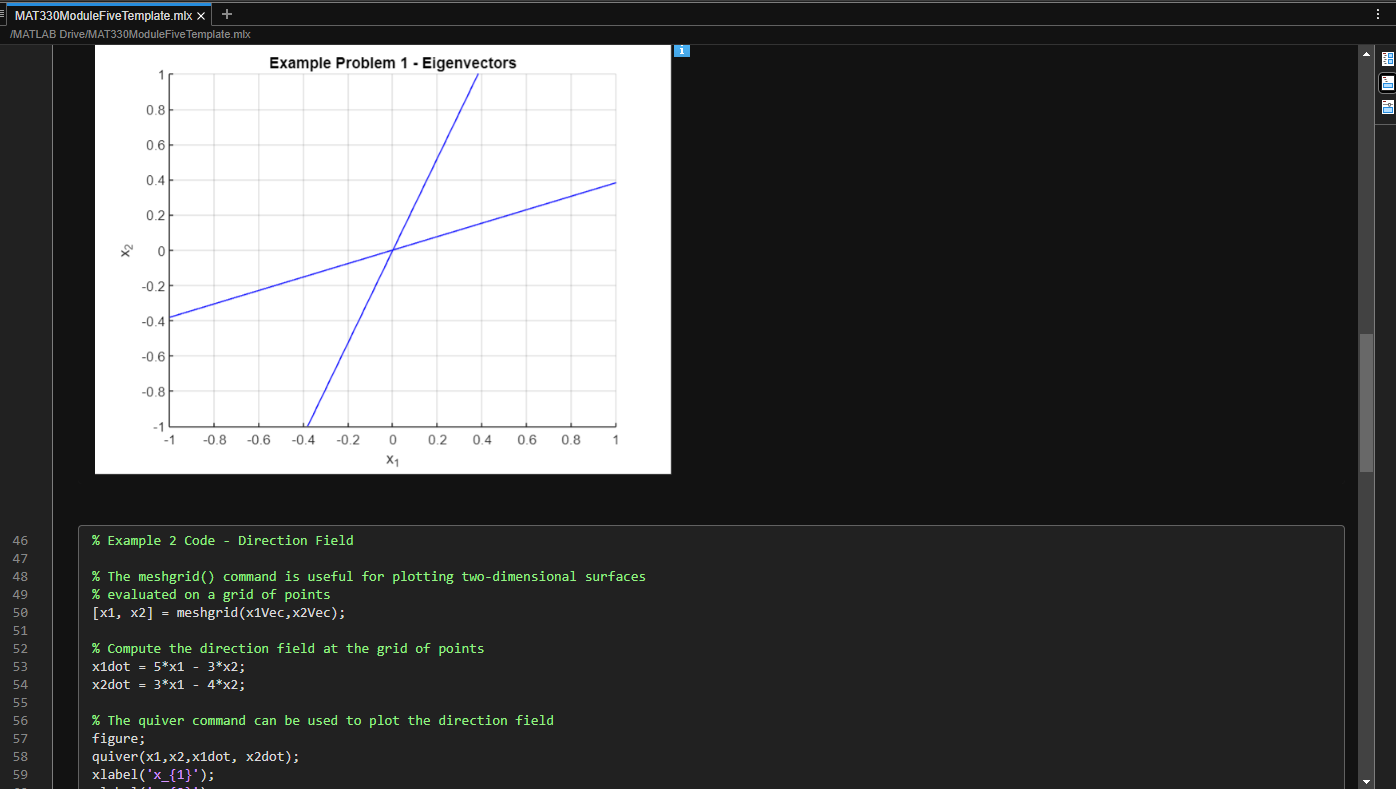
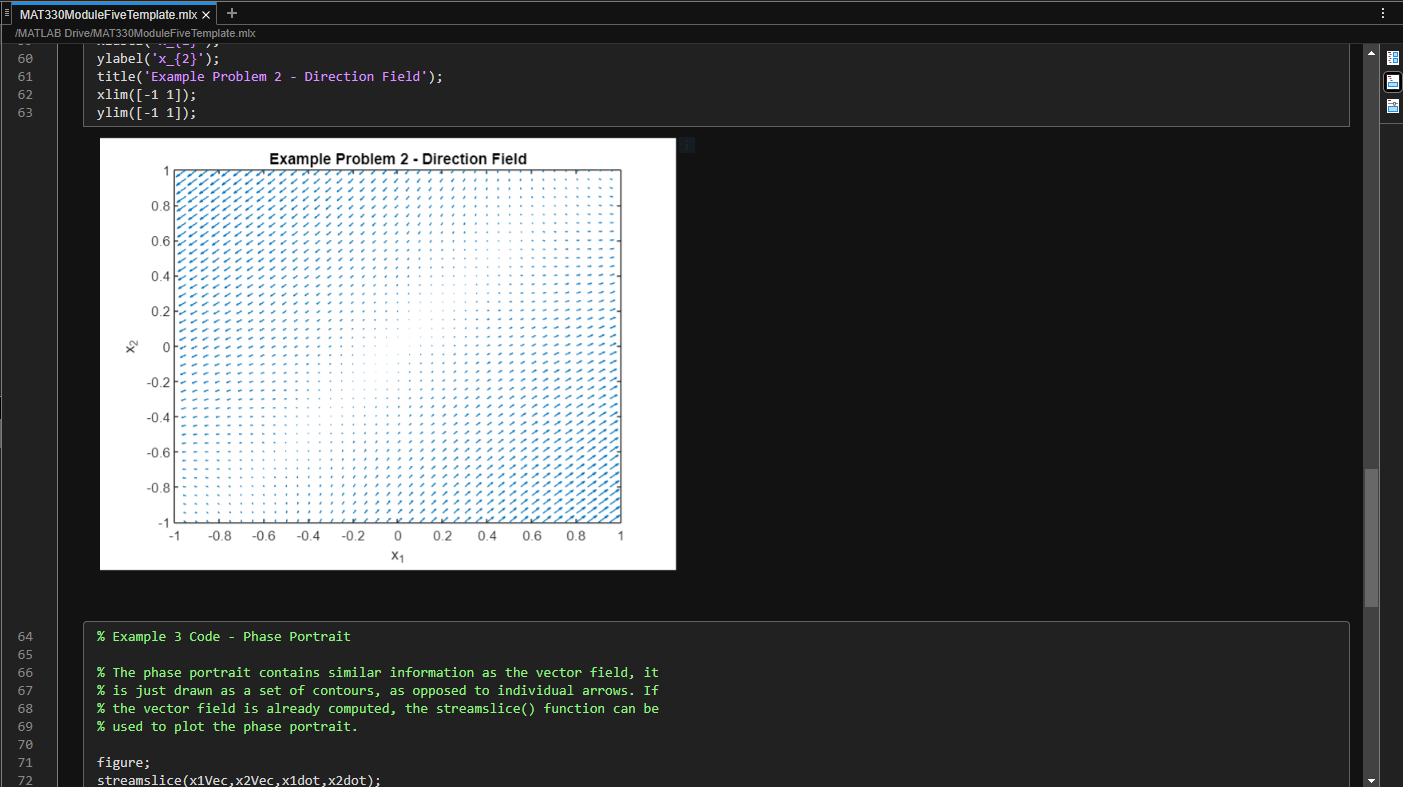
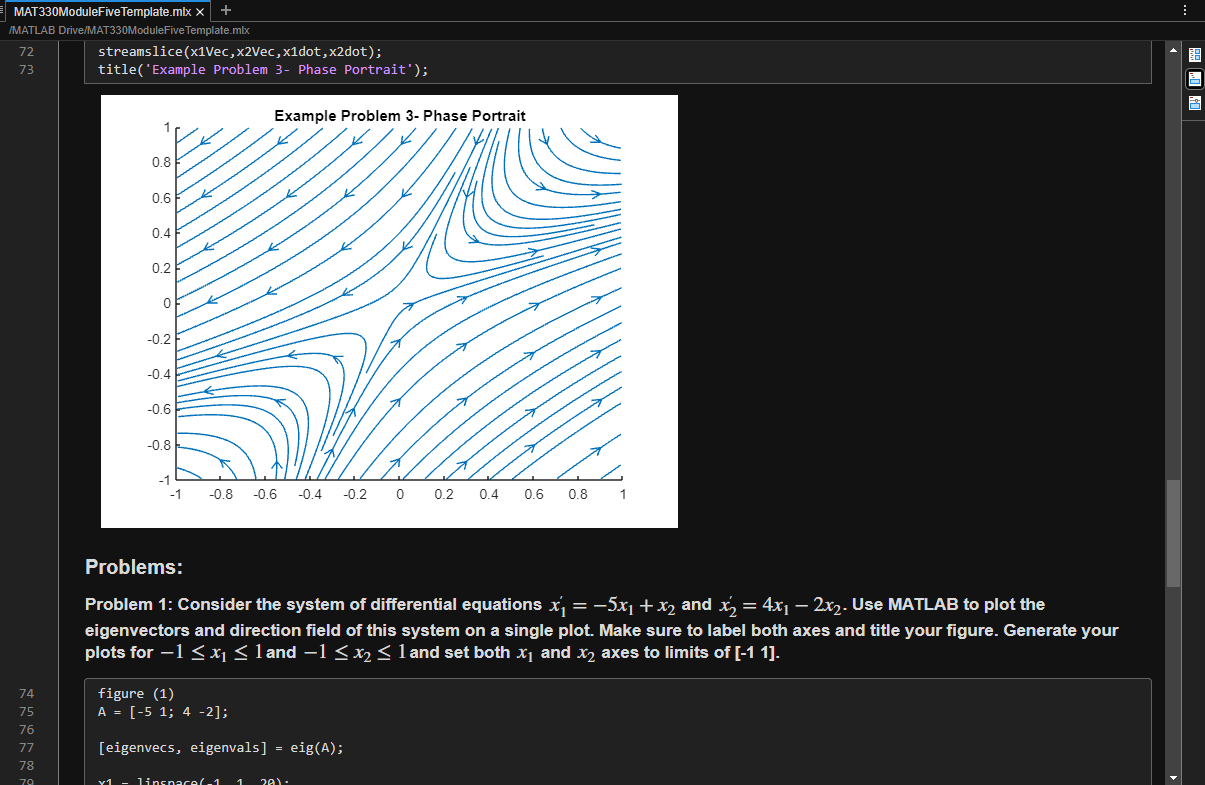
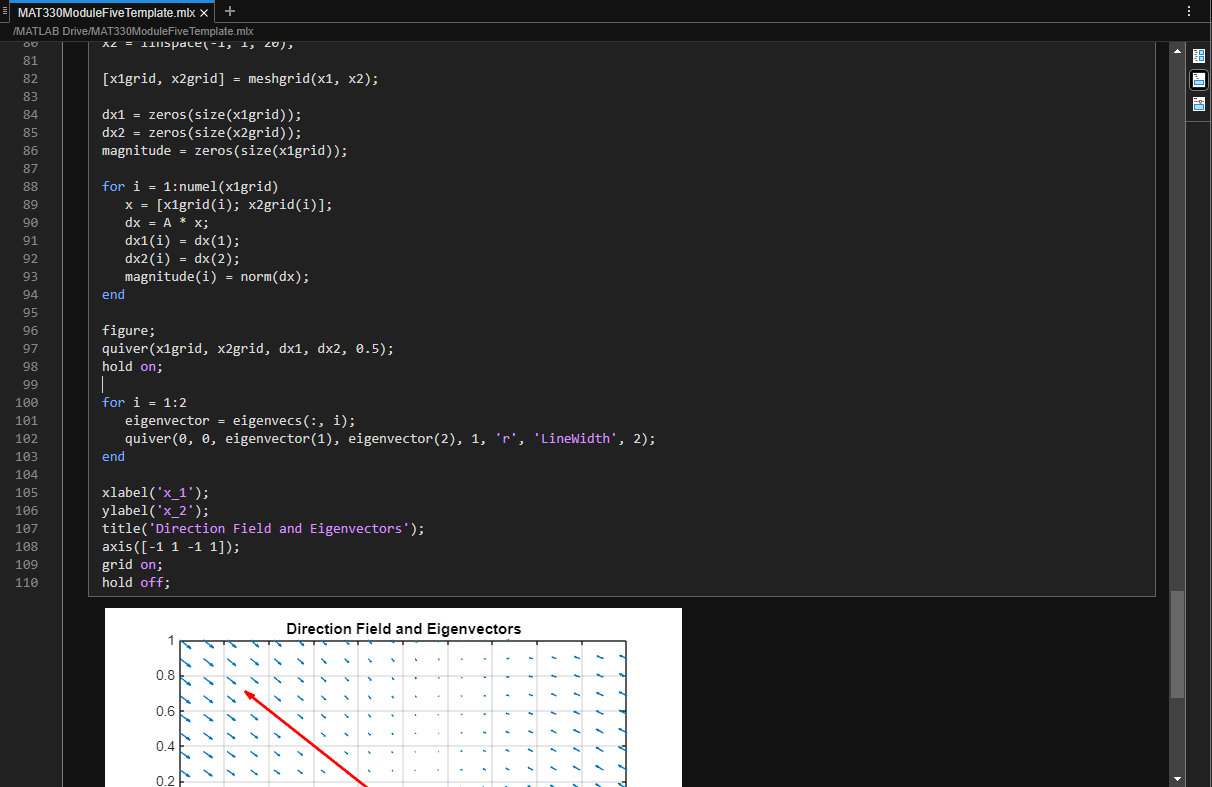
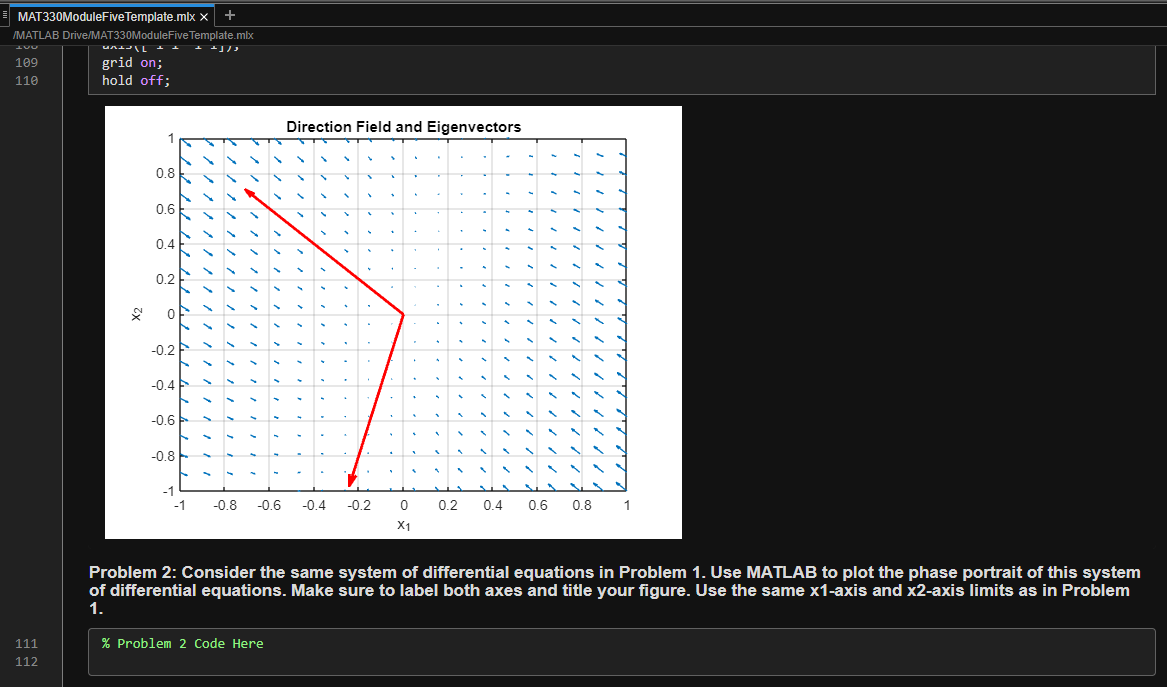
MAT330ModuleFive Template.mlx x /MATLAB Drive/MAT330ModuleFive Template.mix Week 5 - Direction Fields and Phase Portraits MAT330: Differential Equations Logan Hamilton 9-29-2023 Introduction: Systems of differential equations can be analyzed and their solutions found through the use of direction fields, eigenvectors, and phase portraits. In this MATLAB assignment, you'll learn how to create these various plots to aid in understanding the behavior of the solution to a system of differential equations. Review the code and comments provided in the "Examples" section below, and then use this information to complete the problems listed in the "Problems" section. Make sure to run your code so all relevant computations/results are displayed, delete the "Introduction" and "Examples" sections, and then export your work as a PDF file for submission (your submission only needs to contain the "Problems" section that you completed). Examples: % Example 1 Code - Eigenvectors % All of the example problems provided below work with the same system of % differential equations: % % x1' = 5x1-3x2 % x2' = 3x1-4x2 % The coefficient matrix of the system can be written as A = [5 -3; 3 -4]; 10 11 % Computations by hand yield the eigenvectors [2.6180; 1] and [1; 2.6180]. 12 " This can be confirmed by using the MATLAB function eig to compute the 13 % eigenvectors. The eigenvectors are stored as columns of the matrix V below. 14 [V,D] = eiga); 15MAT330ModuleFive Template.mlx x | + /MATLAB Drive/MAT330ModuleFive Template.mix 15 16 " By default, MATLAB normalizes eigenvectors to unit length. 17 % Often, we scale the vectors to have a value of 1 in a coordinate so the 18 % quantities are easier to work with. Changing all values in the vector by 19 % a common factor doesn't change the direction, which is the only important 20 % aspect of the eigenvector. The code below gets these scaled vectors where 21 % we're forcing the smallest entry to a value of 1. 22 v1 = V(:,1) ./min(V(:, 1)) v1 = 2x1 23 v2 = V(:,2) ./min(V(:,2)) v2 = 2x1 NH 24 " To plot the eigenvectors, we need to have vectors for the x1/x2 25 % coordinates to plot against 26 x1Vec = -1:0.05:1; 27 x2Vec = -1:0.05:1; 28 29 % Compute the eigenvectors (Note: these are the v1/v2 relationships found above) 30 vec1 = (1/2.6180)*x1Vec; Xx2 = (1/2.6180)*x1 for eigenvector 1 31 vec2 = (2.6180)*x1Vec; Xx2 = 2.6180*x1 for eigenvector 2 32 33 % Plot the eigenvectors 34 figure; 35 hold on; 36 plot (x1Vec, vec1, 'b' ); 37 plot (x1Vec, vec2, 'b' ); 38 xlabel('x_{1}'); 39 ylabel('x_{2}'); 40 grid on; 41 title( ' Example Problem 1 - Eigenvectors' ); 42 43 % put the axes on the same limits 44 xlim([-1 1]); 45 ylim( [-1 1]);MAT330ModuleFive Template.mlx x + /MATLAB Drive/MAT330ModuleFive Template.mix 1 Example Problem 1 - Eigenvectors 0.8 0.6- 0.4- 0.2 0 -0.2 -0.4 -0.6+ -0.8 -1 -0.8 -0.6 -0.4 -0.2 0 0.2 0.4 0.6 0.8 X1 46 % Example 2 Code - Direction Field 47 48 " The meshgrid() command is useful for plotting two-dimensional surfaces 49 % evaluated on a grid of points 50 [x1, x2] = meshgrid(x1Vec, x2Vec); 51 52 % Compute the direction field at the grid of points 53 x1dot = 5*x1 - 3*x2; 54 x2dot = 3*x1 - 4*x2; 55 56 % The quiver command can be used to plot the direction field 57 figure; 58 quiver (x1, x2, x1dot, x2dot); 59 xlabel('x_{1}' );MAT330ModuleFive Template.mix x + /MATLAB Drive/MAT330ModuleFive Template.mix 60 ylabel('x_{2}'); 61 title( 'Example Problem 2 - Direction Field' ); 62 xlim( [-1 1]); 63 ylim( [-1 1]); Example Problem 2 - Direction Field 0.8 0.6 2 0.4 0.2 0 0.2 -0.4 -0.61 -0.81 -1 -1 -0.8 -0.6 -0.4 -0.2 0 0.2 0.4 0.6 0.8 X1 64 % Example 3 Code - Phase Portrait 65 66 % The phase portrait contains similar information as the vector field, it 67 % is just drawn as a set of contours, as opposed to individual arrows. If 68 " the vector field is already computed, the streamslice() function can be 69 % used to plot the phase portrait. 70 71 figure; 72 streamslice(x1Vec, x2Vec, t, x2dot) ;MAT330ModuleFive Template.mix x | + /MATLAB Drive/MAT330ModuleFive Template.mix 72 streamslice(x1Vec, x2Vec, x1dot, x2dot); 73 title( ' Example Problem 3- Phase Portrait' ); Example Problem 3- Phase Portrait 08 0.6 6 0.4 5 0.2 0 -0.2 -0.4 -0.6 -0.8 -1 8 -0.6 -0.4 -0.2 0 0.2 0.4 0.6 0.8 Problems: Problem 1: Consider the system of differential equations x, = -5x, + x2 and x2 = 4x1 - 2x2- Use MATLAB to plot the eigenvectors and direction field of this system on a single plot. Make sure to label both axes and title your figure. Generate your plots for -1
Step by Step Solution
There are 3 Steps involved in it
1 Expert Approved Answer
Step: 1 Unlock
Question Has Been Solved by an Expert!
Get step-by-step solutions from verified subject matter experts
Step: 2 Unlock
Step: 3 Unlock
Students Have Also Explored These Related Mathematics Questions!