

Question: can you help me with this 3 The table shows the relationship between total product of Good Z and the number of workers employed. Capital
can you help me with this


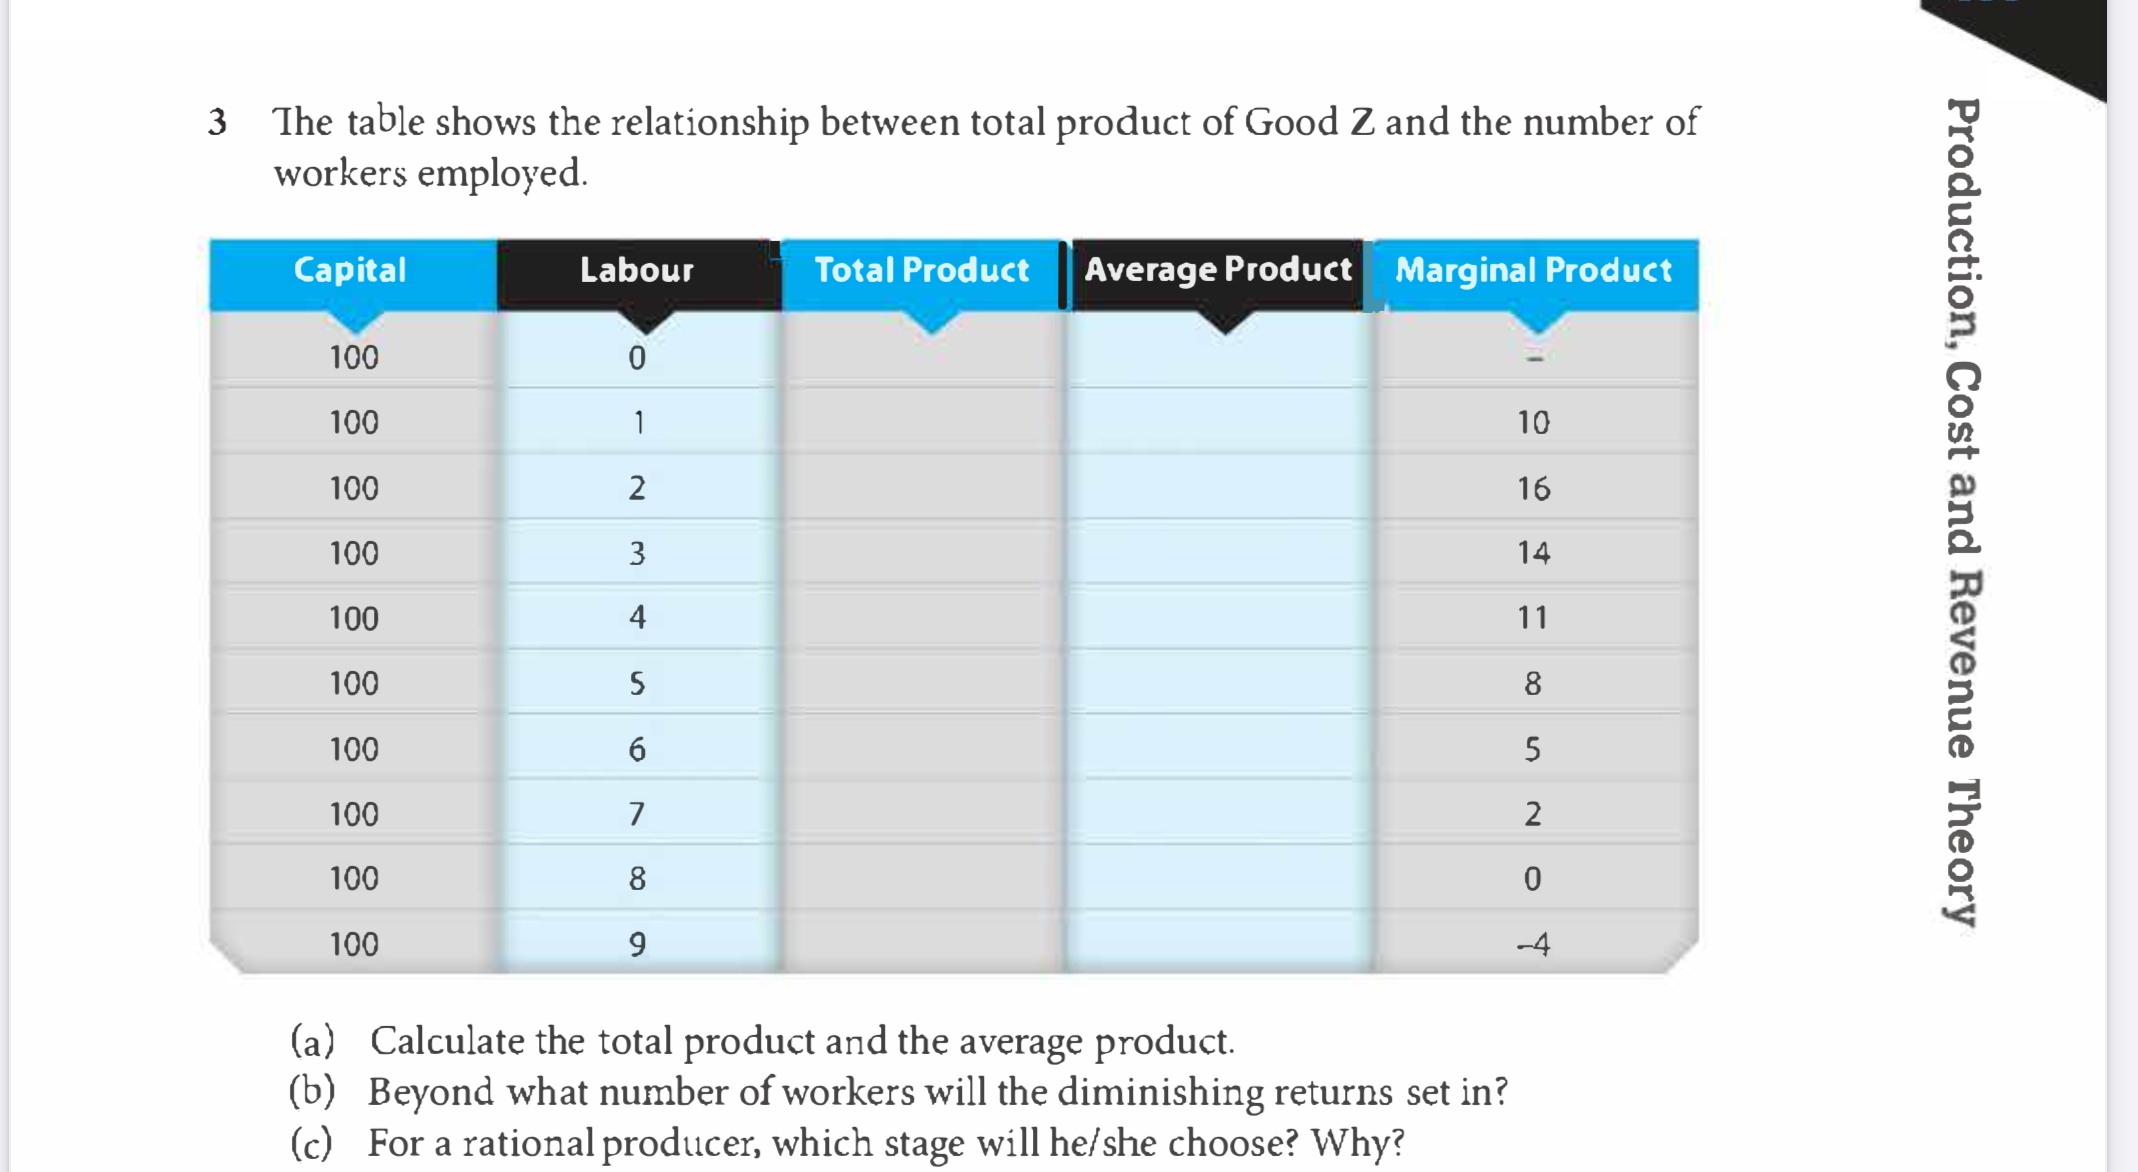
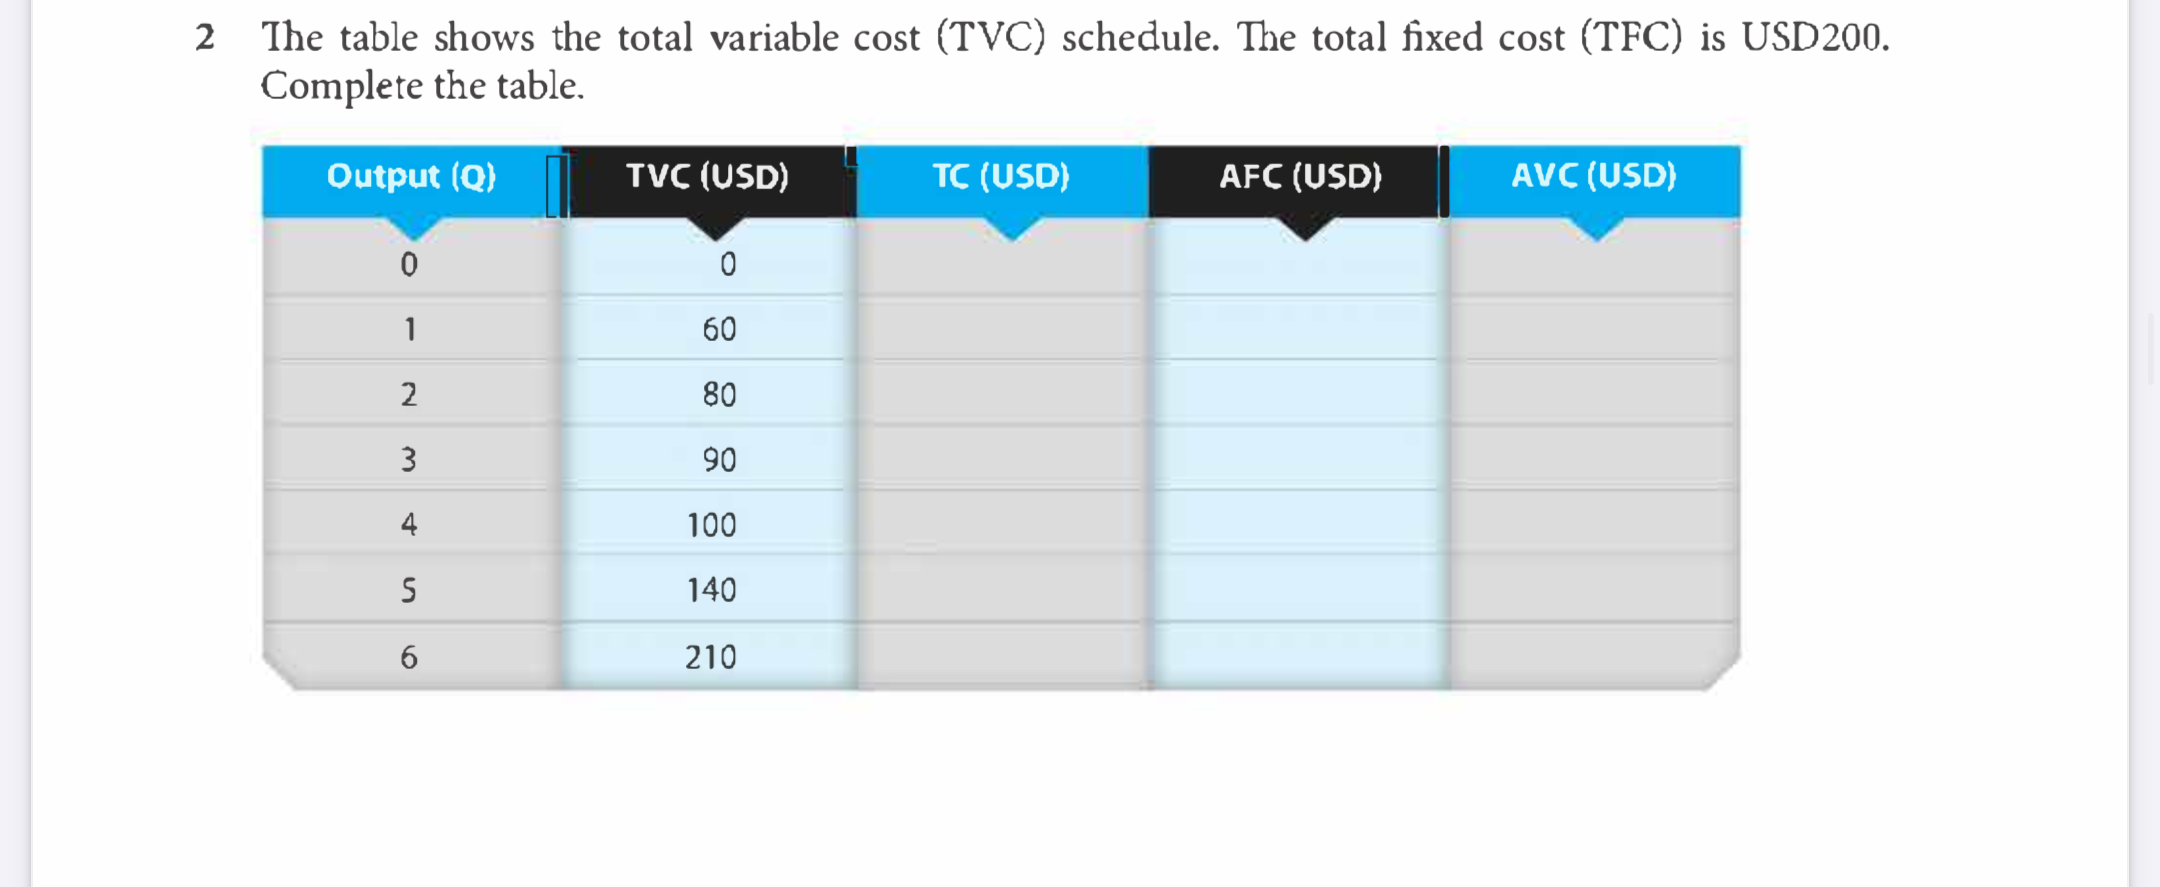
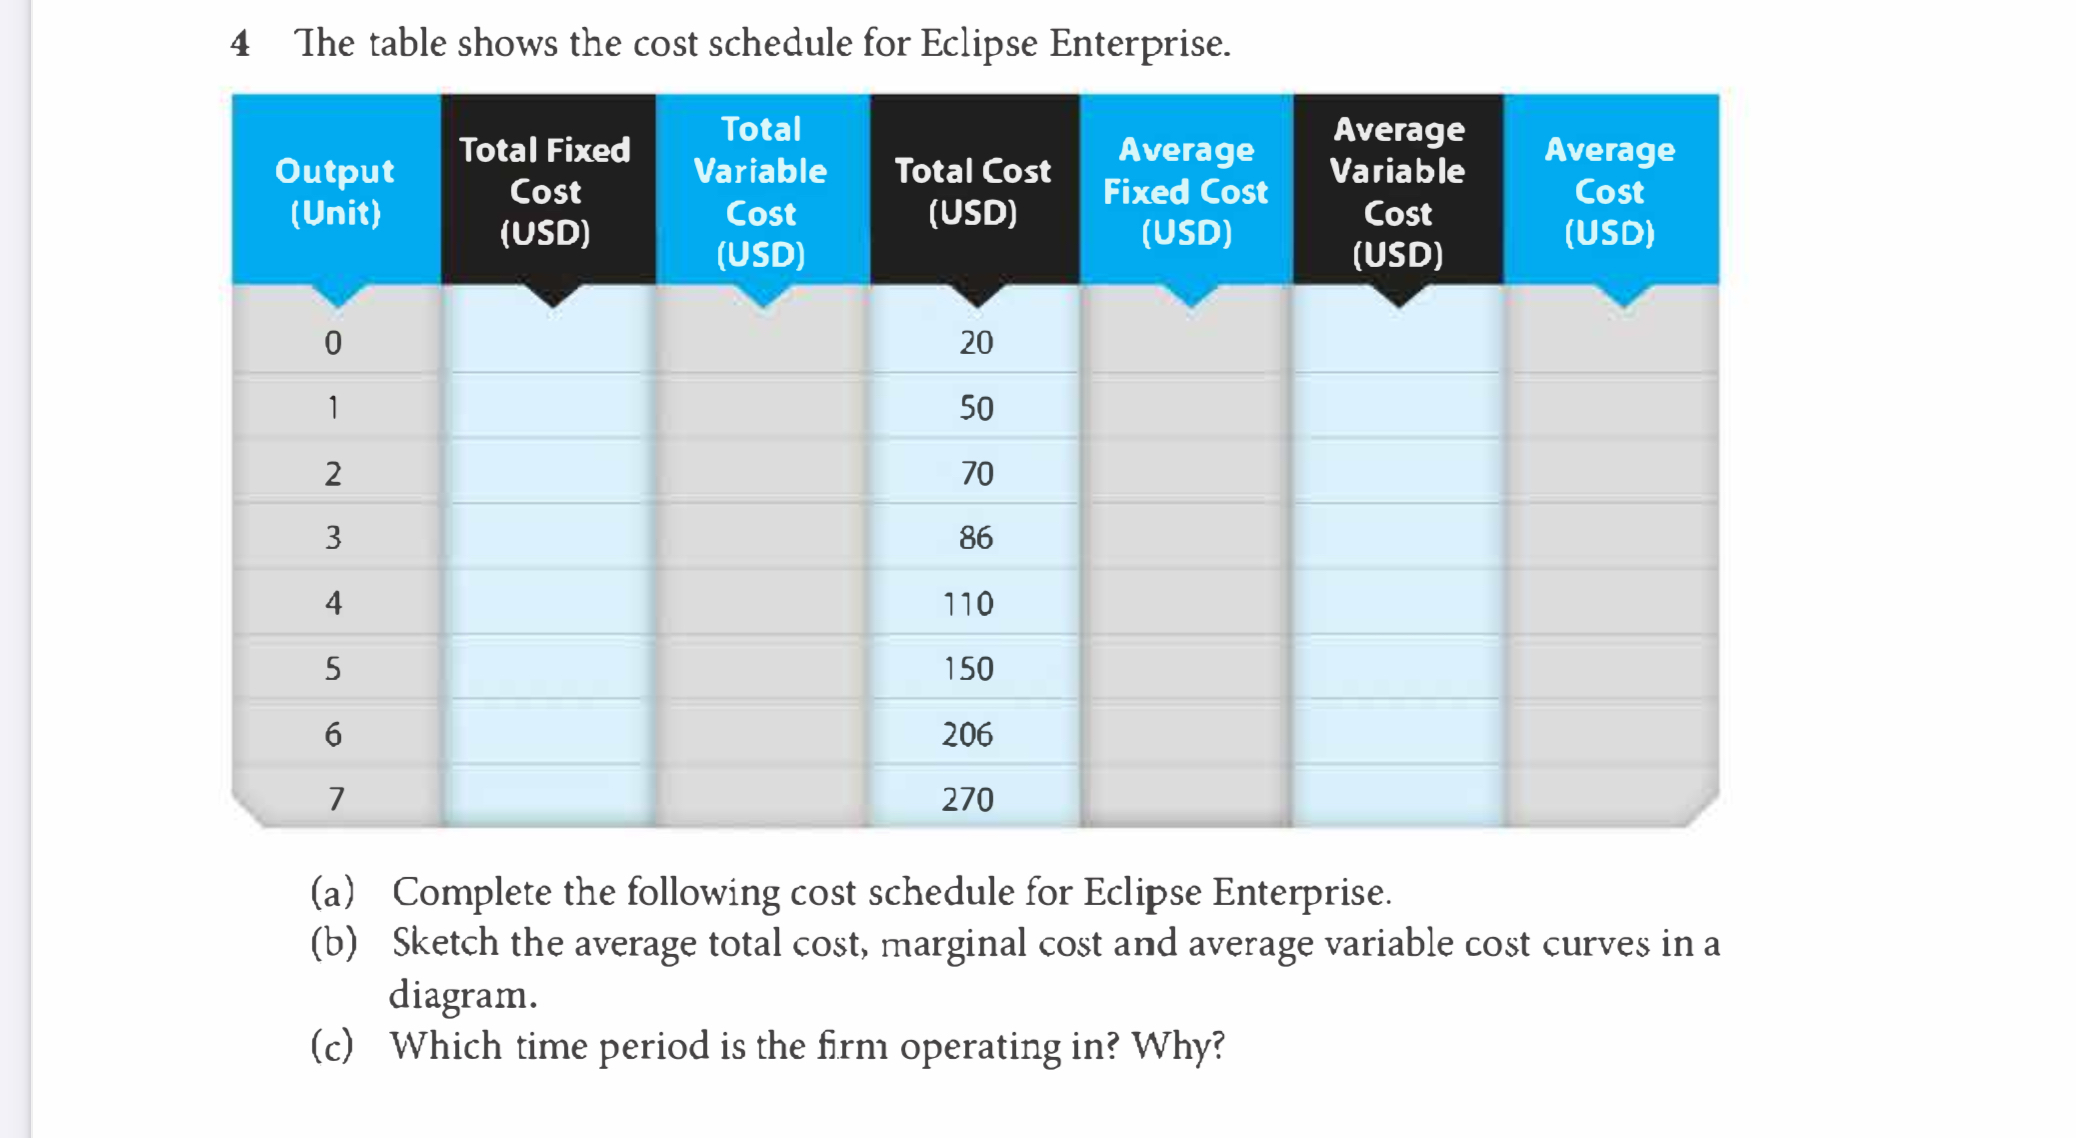
3 The table shows the relationship between total product of Good Z and the number of workers employed. Capital Labour Total Product Average Product Marginal Product 100 0 100 - 10 100 2 16 Production, Cost and Revenue Theory 100 3 14 100 11 100 8 100 6 100 ON U 100 8 100 -4 (a) Calculate the total product and the average product. (b) Beyond what number of workers will the diminishing returns set in? (c) For a rational producer, which stage will he/she choose? Why?2 The table shows the total variable cost (TVC) schedule. The total fixed cost (TFC) is USD200. Complete the table. Output (Q) TVC (USD) TC (USD) AFC (USD) AVC (USD) O 0 60 80 90 U A W N 100 140 6 2104 The table shows the cost schedule for Eclipse Enterprise. . Total Average Output \"'3' F'xed Variable Total Cost 5\"\"99 Variable \"\"9\"\" (Unit) Cost Fixed Cost Cost (USD) Cost (USD) (USD) Cost (USD) (U50) (U50) (a) Complete the following cost schedule for Eclipse Enterprise. (b) Sketch the average total cost, marginal cost and average variable cost curves in a diagram. (c) Which time period is the rm operating in? Why
Step by Step Solution
There are 3 Steps involved in it

Get step-by-step solutions from verified subject matter experts