

Question: Can you help me with this problem? I specifically need to know how to get the answer in Excel. Can you give step by step
Can you help me with this problem? I specifically need to know how to get the answer in Excel. Can you give step by step instructions please?
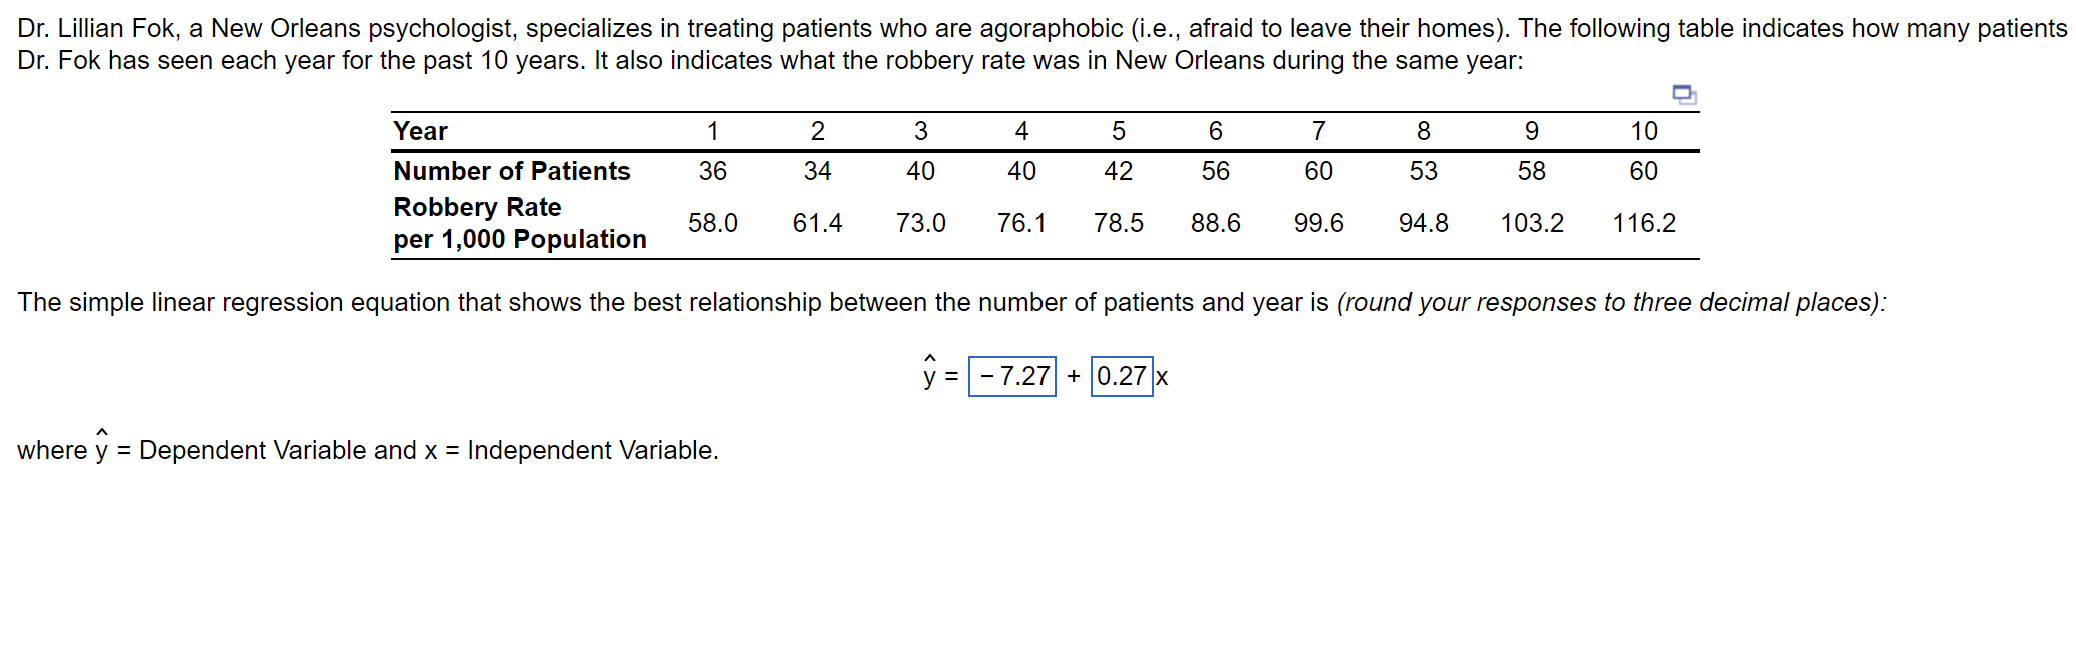
Dr Lillian Fok, a New Orleans psychologist, specializes in treating patients who are agoraphobic ie afraid to leave their homes The following table indicates how many patients
Dr Fok has seen each year for the past years. It also indicates what the robbery rate was in New Orleans during the same year:
The simple linear regression equation that shows the best relationship between the number of patients and year is round your responses to three decimal places:
hat
where hat Dependent Variable and Independent Variable.
Step by Step Solution
There are 3 Steps involved in it
1 Expert Approved Answer
Step: 1 Unlock

Question Has Been Solved by an Expert!
Get step-by-step solutions from verified subject matter experts
Step: 2 Unlock
Step: 3 Unlock