

Question: can you help me with this problem Question 9. Problem 23 Part 1 of 2 HW Score: 83.42%, 11.68 of 14 points Points: 0.67 of
can you help me with this problem 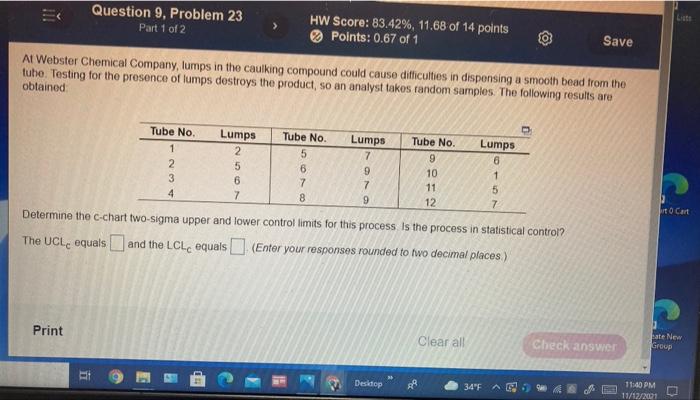
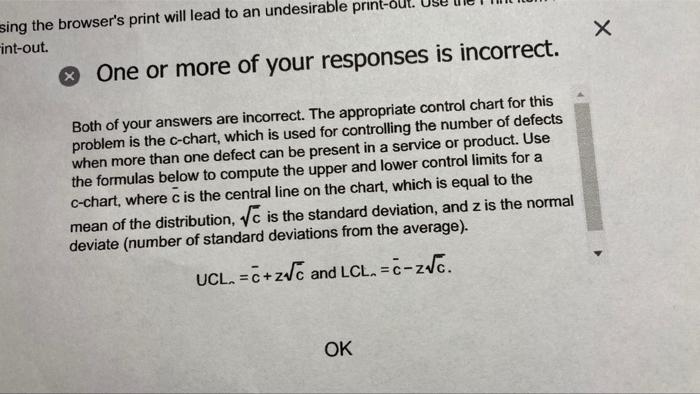
Question 9. Problem 23 Part 1 of 2 HW Score: 83.42%, 11.68 of 14 points Points: 0.67 of 1 Save Al Webster Chemical Company, lumps in the caulking compound could cause difficulties indispensing a smooth bead from the tube Testing for the presence of lumps destroys the product, so an analyst takes random samples. The following results are obtained Tube No. Tube No. 1 2 3 4 Lumps 2 5 6 7 Tube No. 5 6 7 8 Lumps 7 9 7 9 9 10 11 12 Lumps 6 1 5 7 lito Cart Determine the c-chart two-sigma upper and lower control limits for this process is the process in statistical control? The UCL. equals and the LCL equals (Enter your responses rounded to two decimal places) Print Clear all Check answer Late New Group Desktop 34"F AC 11:40 PM 11/12/2001 sing the browser's print will lead to an undesirable print int-out. * One or more of your responses is incorrect. Both of your answers are incorrect. The appropriate control chart for this problem is the c-chart, which is used for controlling the number of defects when more than one defect can be present in a service or product. Use the formulas below to compute the upper and lower control limits for a c-chart, where c is the central line on the chart, which is equal to the mean of the distribution, Vc is the standard deviation, and z is the normal deviate (number of standard deviations from the average). UCL. =c+z/c and LCL, =c-zdc. OK
Step by Step Solution
There are 3 Steps involved in it
1 Expert Approved Answer
Step: 1 Unlock

Question Has Been Solved by an Expert!
Get step-by-step solutions from verified subject matter experts
Step: 2 Unlock
Step: 3 Unlock