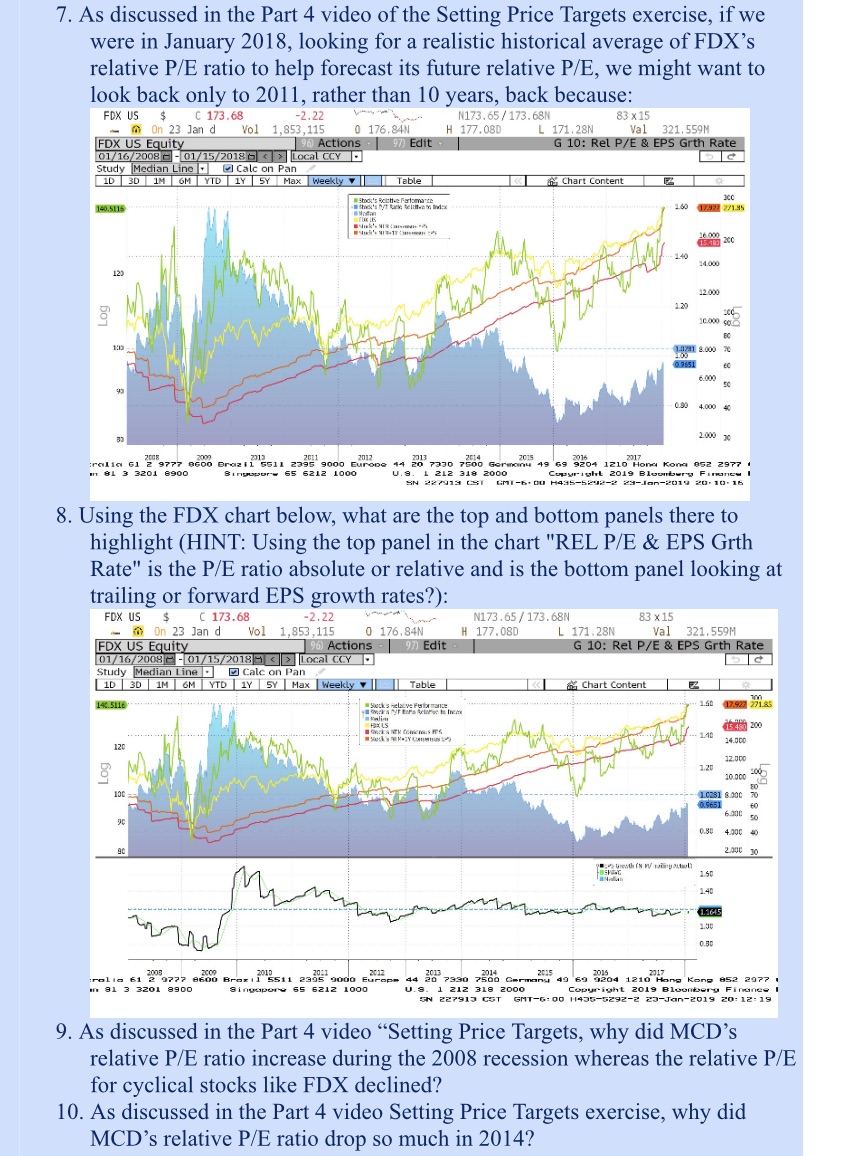
Question: Can you help please 7. As discussed in the Part 4 video of the Setting Price Targets exercise, if we were in January 2018, looking

Can you help please

Can you help please 7. As discussed in the Part 4
7. As discussed in the Part 4 video of the Setting Price Targets exercise, if we were in January 2018, looking for a realistic historical average of FDX's relative P/E ratio to help forecast its future relative P/E, we might want to look back only to 2011, rather than 10 years, back because: FDX US $ C 173.68 -2.22 N173. 65/ 173. 68N 83 x 15 On 23 Jan d Vol 1,853, 115 0 176.84N H 177.08D L 171. 28N Val 321.559M FOX US Equity 196 Actions . | 97) Edit G 10: Rel P/E & EPS Grth Rate 01/16/2008 - - 01/15/2018 Local CCY Study Median Line . ) Calc on Pan 10 30 1M GM YTD 19 5Y Max Weekly V Table Chart Content 30C 140.5115 17.92 271.45 -140 14.030 12 12 030 Loc EC 0.50 4.000 43 2.000 30 frolic 61 2 9777 8600 Brozl1 6511 2395 9000 Europe 44 20 7330 7500 Gorskinu 49 69 9204 1210 Hong Kong 052 2977 on #1 3 3201 8900 Bingopure 65 6212 1000 1 212 318 2000 Copyright 2019 Bloomberg Findnew SN 227919 CST GMI-6:00 H435-5292-2 29-Jon-2019 20 :10. 15 8. Using the FDX chart below, what are the top and bottom panels there to highlight (HINT: Using the top panel in the chart "REL P/E & EPS Grth Rate" is the P/E ratio absolute or relative and is the bottom panel looking at trailing or forward EPS growth rates?): FOX US $ C 173.68 -2.22 N173 . 65 / 173. 68N 83 x 15 On 23 Jan d Vol 1, 853 ,115 0 176.84N H 177. 080 L 171.28N Val 321.559M FDX US Equity 1 96 Actions - | 97) Edit G 10: Rel P/E & EPS Grth Rate 01/16/2008 - - 01/15/2018 - Local CCY Study Median Line . Calc on Pan 1D 30 1M GM YTD 1Y 5Y Max Weekly Table Chart Content 140.5116- 1.40 17.923 271 85 15 456 200 14.000 120 12.0 00 1.20 Log 10.000 - 1.0281 8 000 70 0.5651 0.80 4090 20 2040 30 1.50 1.40 1.1645 1.50 0.30 calla 61 2 9777 8600 Brazil 9511 2395 9000 Europe 44 20 7330 7500 Germany 49 69 3204 1210 Hong Kong 852 2977 . DOES TOZE E TE Singapore 65 6212 1000 U.S. 1 212 318 2000 Copyright 2019 Bloomberg Finones 61:21:02 6102-UDC-C2 2-2625-SCH 00:9-105 195 C16222 NS 9. As discussed in the Part 4 video "Setting Price Targets, why did MCD's relative P/E ratio increase during the 2008 recession whereas the relative P/E for cyclical stocks like FDX declined? 10. As discussed in the Part 4 video Setting Price Targets exercise, why did MCD's relative P/E ratio drop so much in 2014

Step by Step Solution

There are 3 Steps involved in it

1 Expert Approved Answer
Step: 1 Unlock blur-text-image
Question Has Been Solved by an Expert!

Get step-by-step solutions from verified subject matter experts

Step: 2 Unlock
Step: 3 Unlock

Students Have Also Explored These Related Finance Questions!