

Question: Can you help please QUESTION 16 Year CPI 2008 99 2009 100 2010 105 2011 104 2012 106 According to the table shown above g
Can you help please
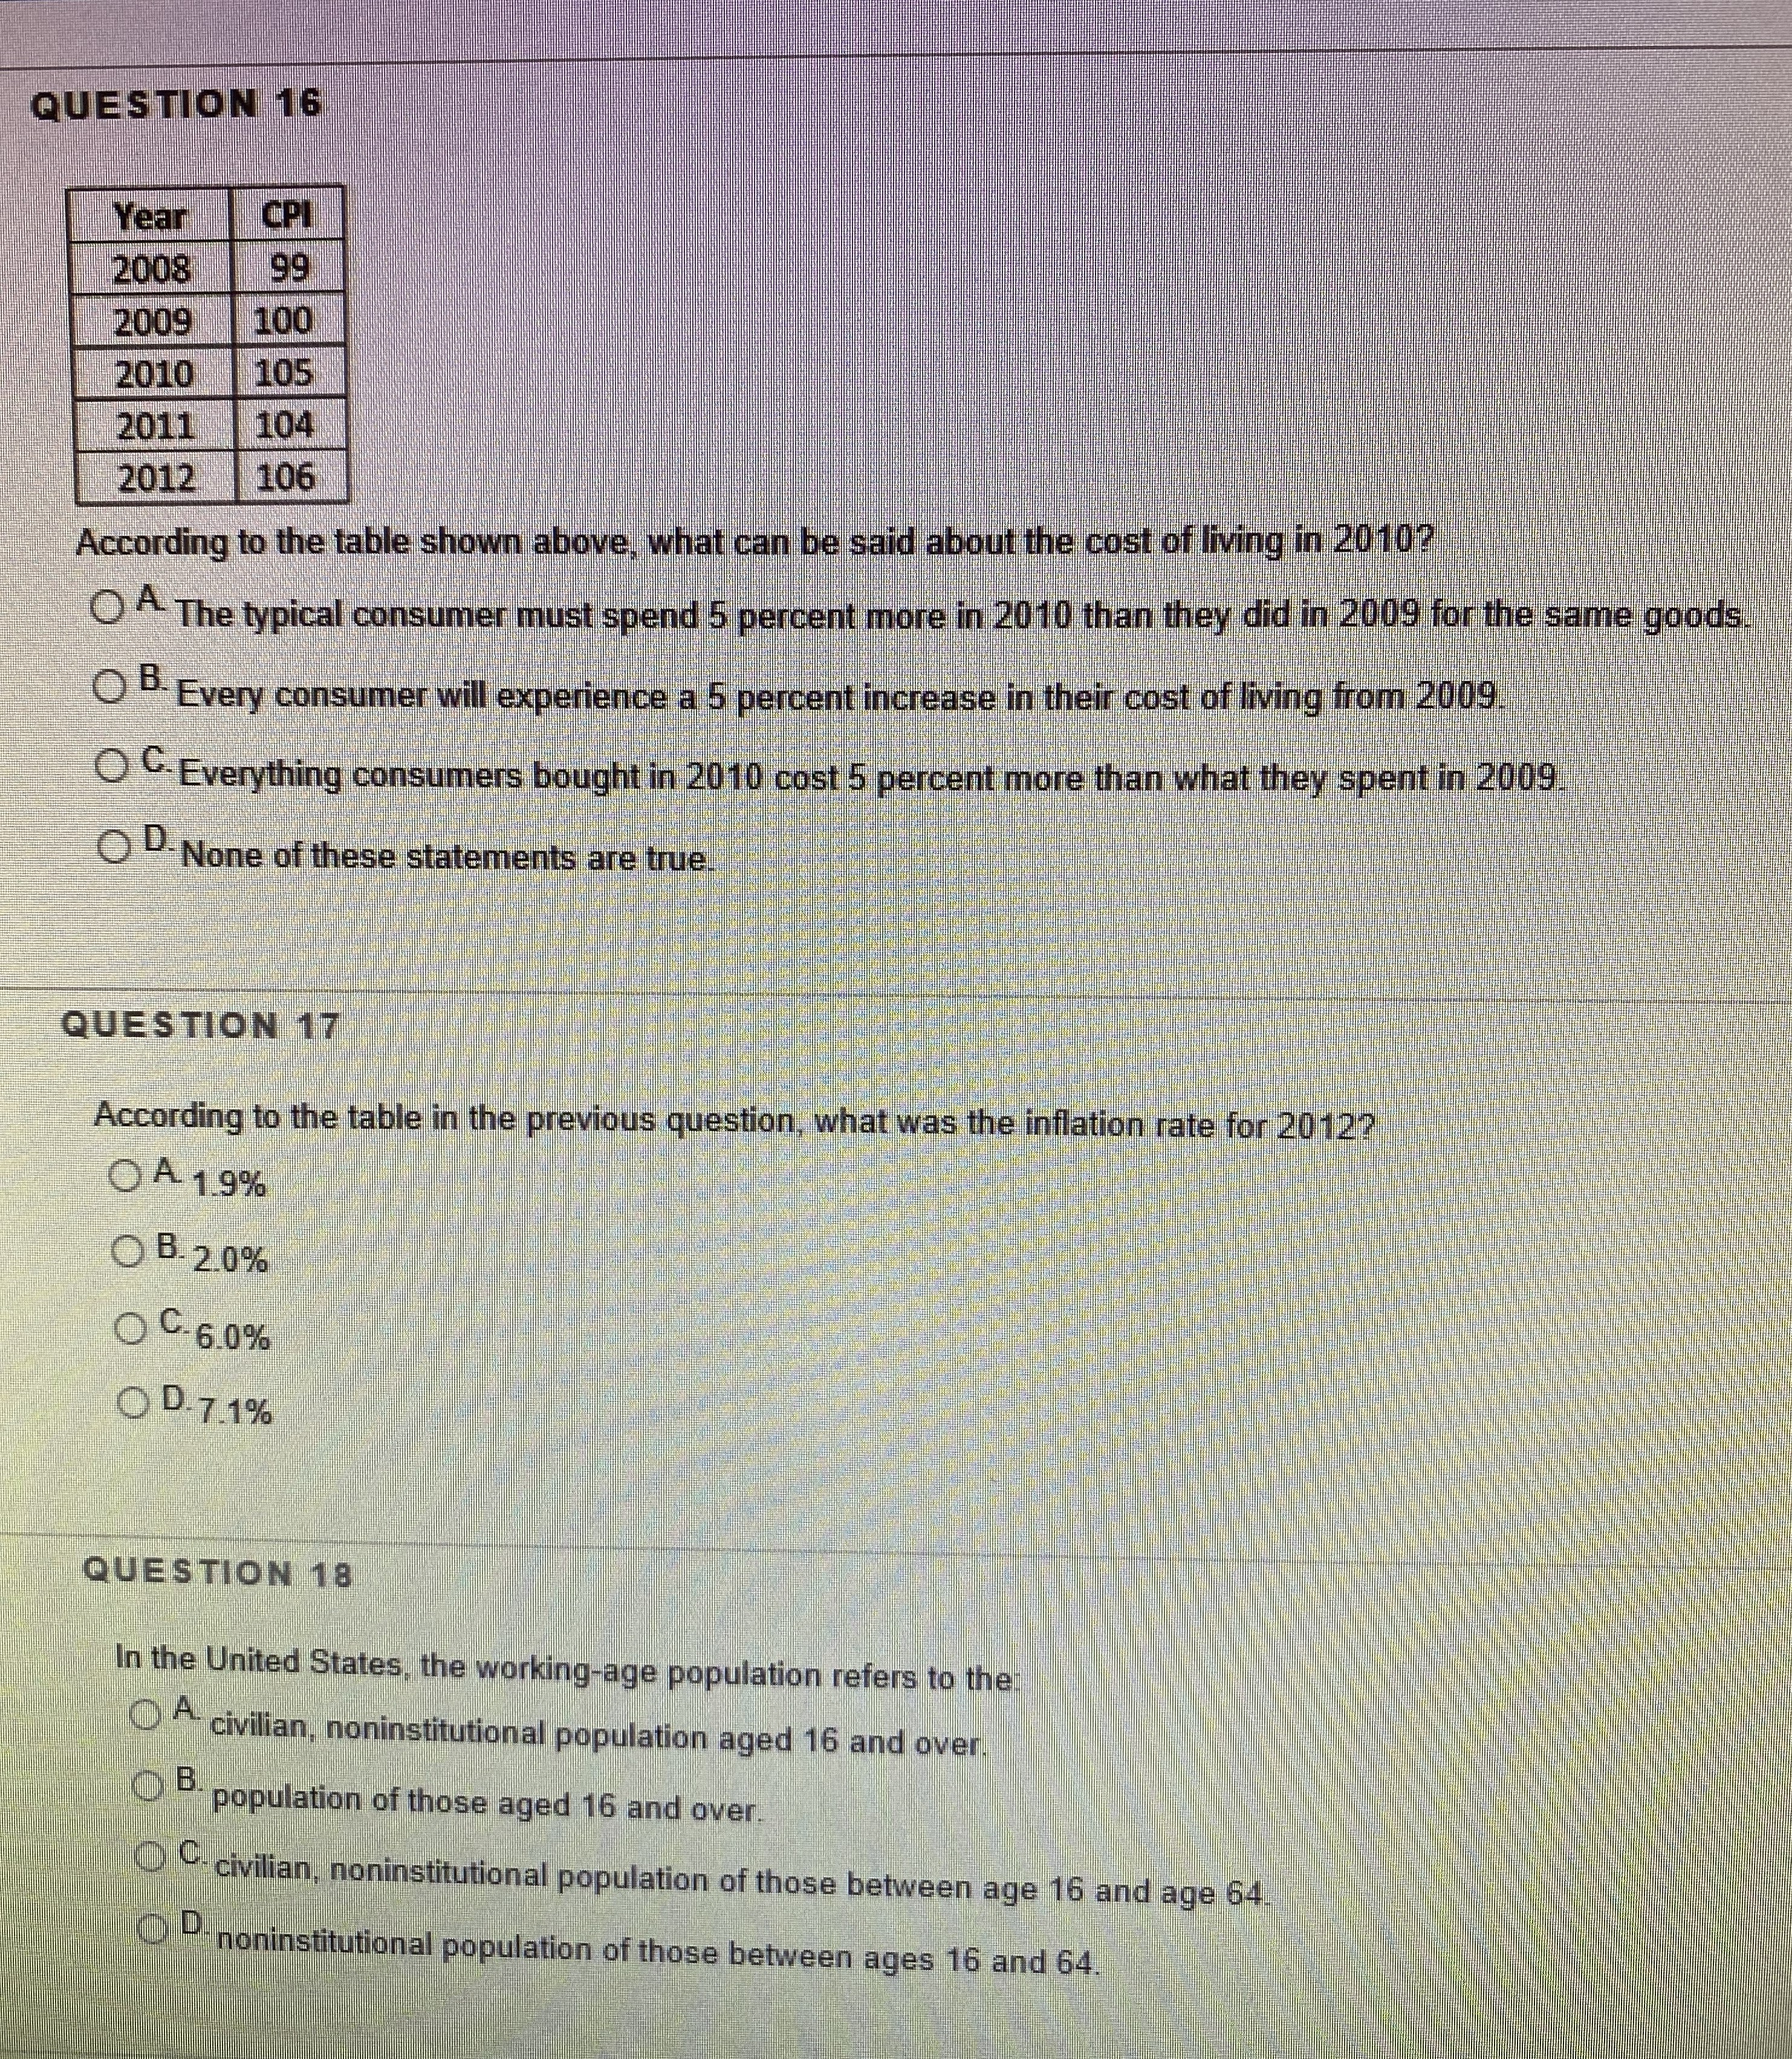
QUESTION 16 Year CPI 2008 99 2009 100 2010 105 2011 104 2012 106 According to the table shown above g in 2010? O A The typical consumer 2009 O B. Every consumer v O G. Everything consumers | O D. None of these statements QUESTION 1 According to the table in the previous ion rate O A 1.9% B- 2.0% O -6.0% O D.7.1% QUESTION 18 In the United States, the working-age population refers to the O civilian, noninstitutional population aged 16 and over B. population of those aged 16 and over. civilian, noninstitutional population of those between age 16 and age 64 noninstitutional population of those between ages 16 and 64
Step by Step Solution
There are 3 Steps involved in it

Get step-by-step solutions from verified subject matter experts