

Question: can you help solve problem b please? The data represent the number of driving fatalities for a certain area by age for male Male Female
can you help solve problem b please?
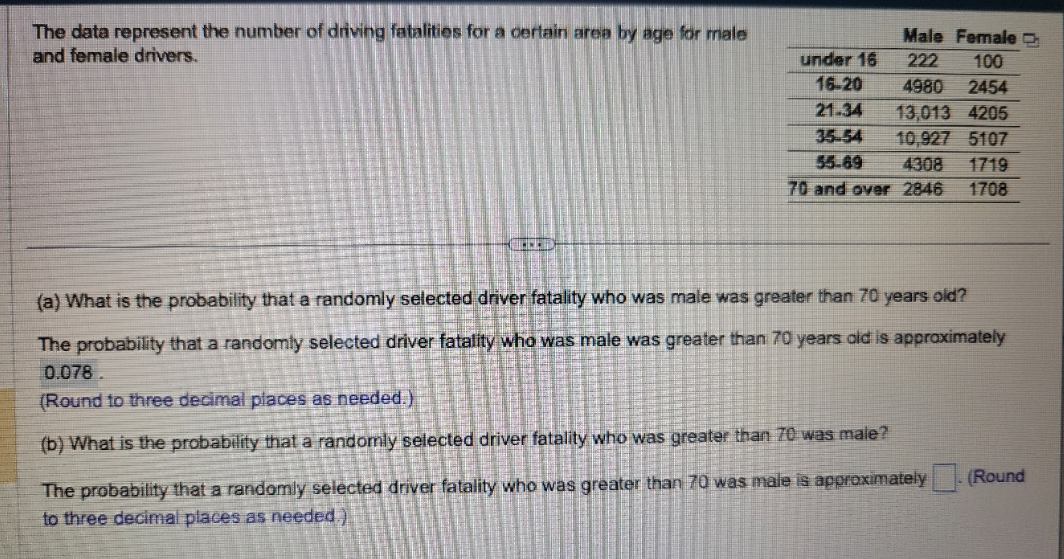
The data represent the number of driving fatalities for a certain area by age for male Male Female and female drivers. under 16 222 100 16-20 4980 2454 21-34 13,013 4205 35-54 10.927 5107 55-69 4308 1719 70 and over 2846 1708 (a) What is the probability that a randomly selected driver fatality who was male was greater than 70 years old? The probability that a randomly selected driver fatality who was male was greater than 70 years old is approximately 0.078 (Round to three decimal places as needed.) (b) What is the probability that a randomly selected driver fatality who was greater than 70 was male? The probability that a randomly selected driver fatality who was greater than 70 was male is approximately (Round to three decimal places as needed.)
Step by Step Solution
There are 3 Steps involved in it

Get step-by-step solutions from verified subject matter experts