

Question: Can you help with the problems that are circled. Those are 73, 96, 16, and 20. Thanks so much! :) FIGURE 21 In Exercises 6972,

Can you help with the problems that are circled. Those are 73, 96, 16, and 20. Thanks so much! :)
![(a, 3:) sm:;'- 69. fix) =x +x-1, [21,2] x2 71' x): 8x](https://s3.amazonaws.com/si.experts.images/answers/2024/06/6665c53ac53ac_6586665c53a9c8fe.jpg)
![15' [3.5] '72. f(x) = sinzx cos2 x, g, 32\" @Prove that](https://s3.amazonaws.com/si.experts.images/answers/2024/06/6665c53b2cdb2_6596665c53b08dda.jpg)

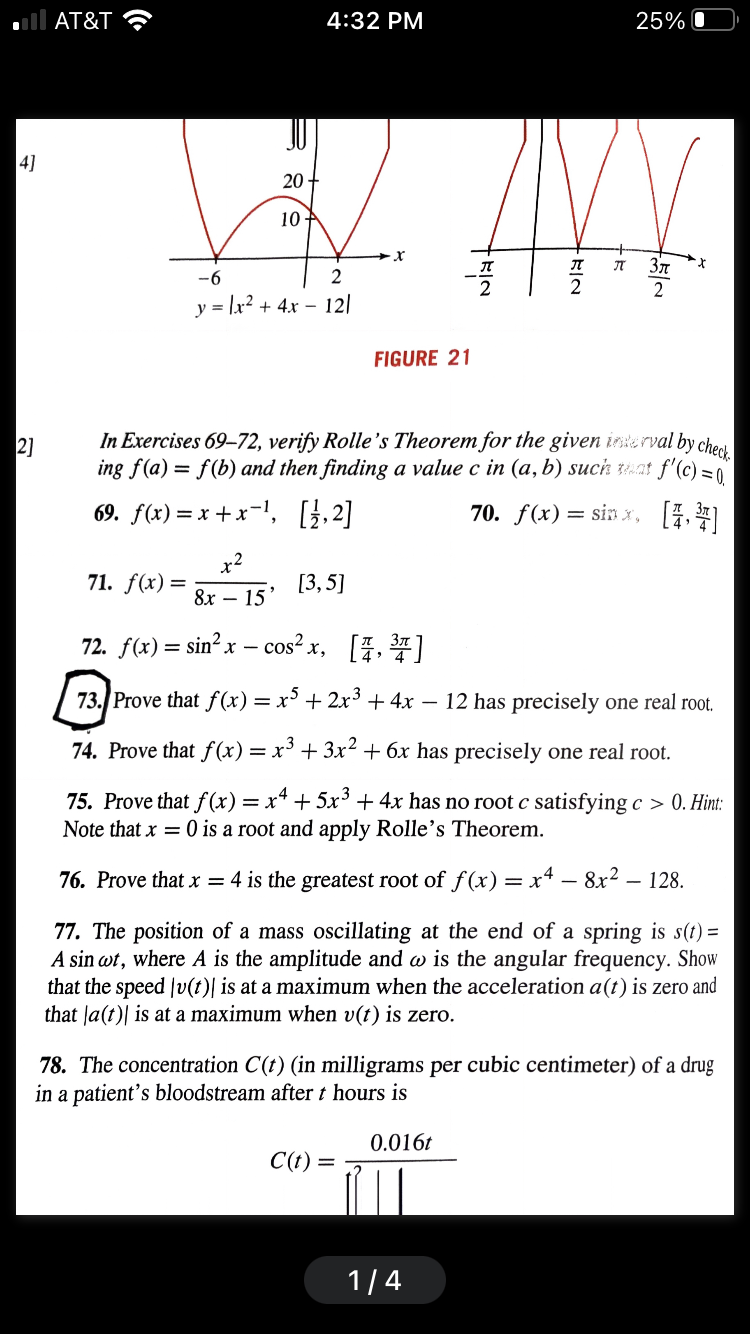
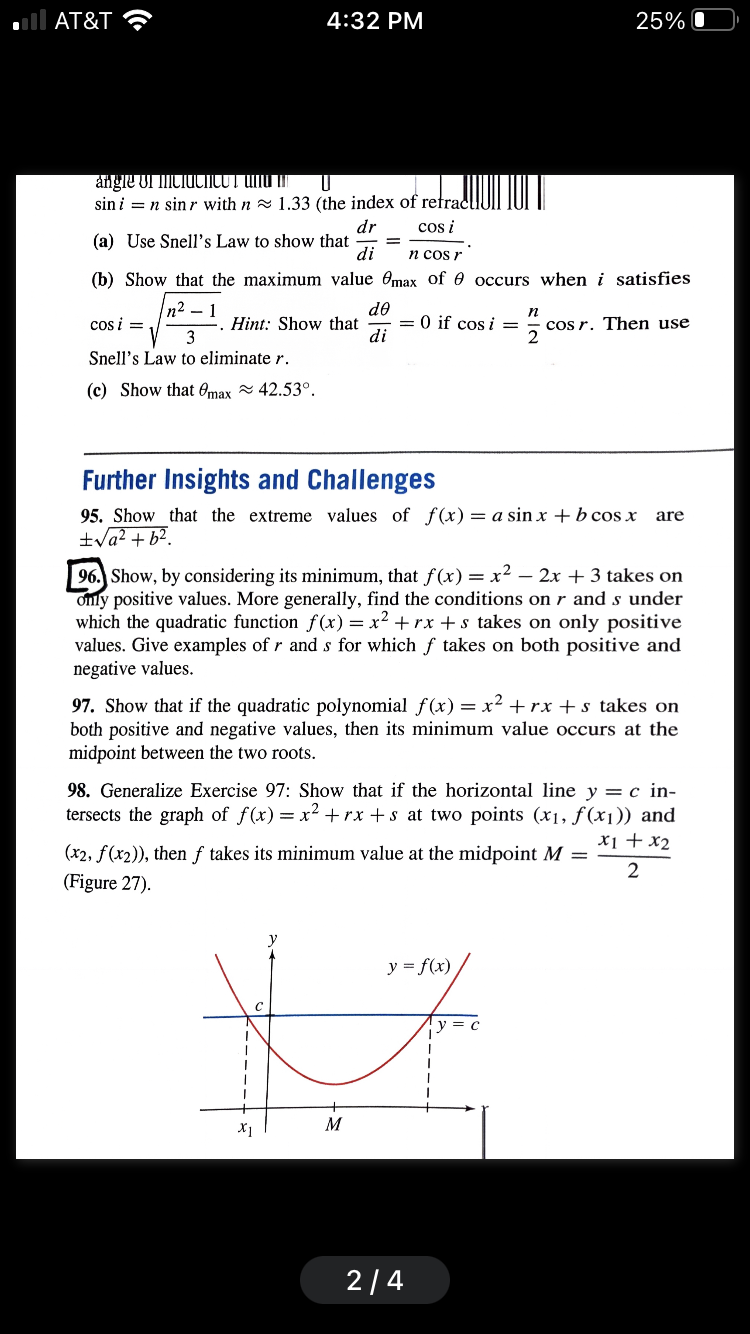
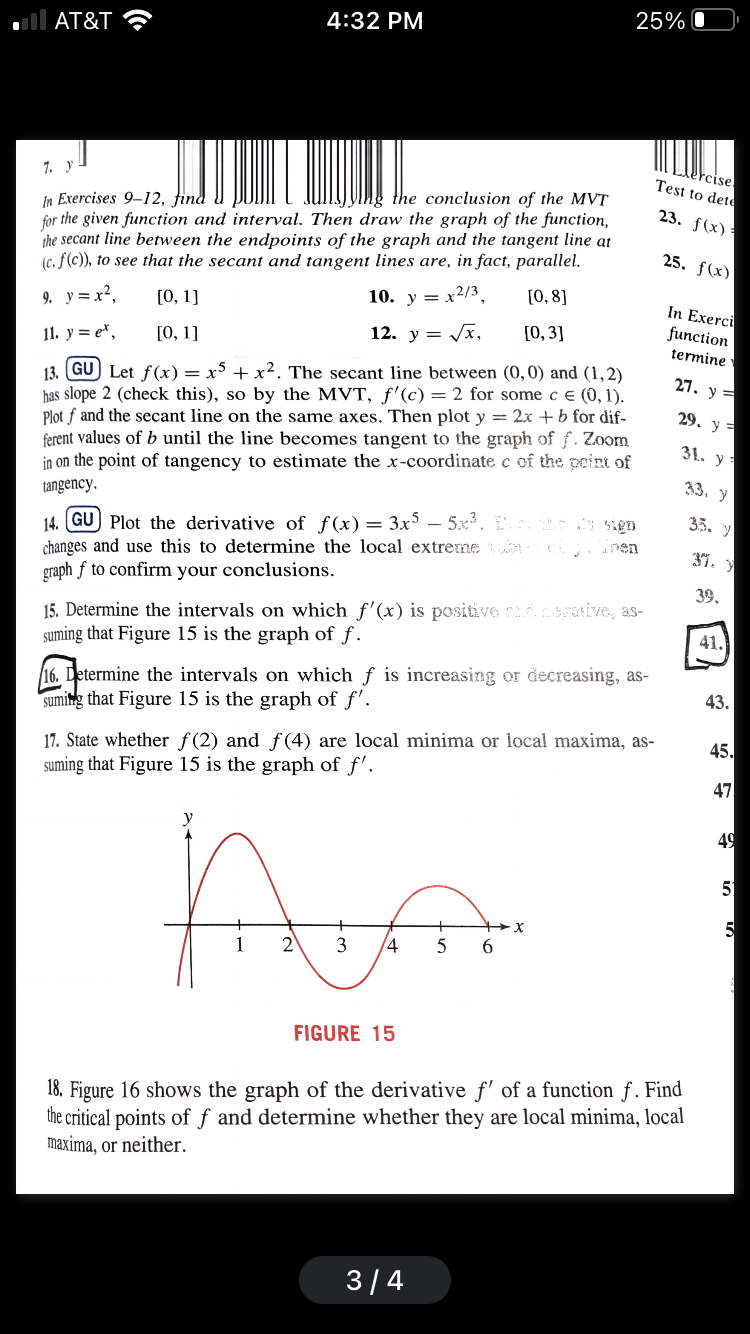
FIGURE 21 In Exercises 6972, verify Rolfe 's Theorem for the given J- .. -. ing fig) = f (b) and then nding a value c in (a, 3:) sm:;'- 69. fix) =x +x-1, [21,2] x2 71' x): 8x 15' [3.5] '72. f(x) = sinzx cos2 x, g, 32\" @Prove that f(x) = x5 + 2x3 + 4x l2 has precisely one real root. 74. Prove that f(x) = x3 + 3x2 + 61: has precisely one real root 75. Prove that f (x) = x4 + 513 + 4x has no root c satisfying (3 :> U. Him: Note that x = O is a root and apply Rolle's Theorem. 76. Prove thatx = 4 is the greatest root of f(x) = x4 8x2 l28. 77. The position of a mass oscillating at the end of a spring is sit) : A sin mt, where A is the amplitude and a) is the angular frequency. Show that the speed WU)! is at a maximum when the acceleration am is zero and that fair)! is at a maximum when UH) is zero. '78. The concentration C (I) (in milligrams per cubic centimeter) of a drug in a patient's bloodstream after 1? hours is 0.016: C0\") = # sini : n sinr with it m 1.33 (the index of re ra dr cos i (a) Use Snell's Law to show that ,- = . d: It cos r (b) Show that the maximum value 6mm of 6 occurs when i satises .I' 2 1 d6 _ cosi = n q . Him: Show that a = 0 if cost = geosr. Then use Snell's Law to eliminate r. 0:) Show that 6mm 9:; 42.53". Further Insights and Challenges 95. Show that the extreme values of 'f'(x)=asinx+bcosx are iS/Ci'z + 73. I 96.) Show. by considering its minimum, that fix) = x2 2x + 3 takes on 3* positive values. More generally, find the conditions on r and 5 under which the quadratic function f(x) : x2 + F): + .9 takes on only positive values. Give examples of r and s for which f takes on both positive and negative values. 9?. Show that if the quadratic polynomial ftx) : x2 + rx + 5 takes on both positive and negative values, then its minimum value occurs at the midpoint between the two roots. 98. Generalize Exercise 97: Show that if the horizontal line y = c in tersects the graph of ftx) :- I2 + r): | s at two points (x1, ftxl'n and xi + 2 (X2,f(x2)), then f takes its minimum value at the midpoint M : 2 (Figure 2?). AT&T 4:32 PM 25% O 7. reise In Exercises 9-12, find the conclusion of the MVT Test to dete for the given function and interval. Then draw the graph of the function, 23. f (x) the secant line between the endpoints of the graph and the tangent line at (c, f(c)), to see that the secant and tangent lines are, in fact, parallel. 25. f (x) 9. y= x2, [0, 1] 10. y = x2/3, [0, 8] In Exerci 11. y = ex, [0, 1] 12. y = Vx, [0, 3] function termine 13. GU Let f(x) = x's + x2. The secant line between (0, 0) and (1, 2) has slope 2 (check this), so by the MVT, f'(c) = 2 for some c E (0, 1). 27. y = Plot f and the secant line on the same axes. Then plot y = 2x + b for dif- 29. y ferent values of b until the line becomes tangent to the graph of f. Zoom in on the point of tangency to estimate the x-coordinate c of the point of 31. y tangency. 33. y 14. GU Plot the derivative of f(x) = 3x -535. : li sign 35. y changes and use this to determine the local extreme wa ( ) , nen graph f to confirm your conclusions. 39. 15. Determine the intervals on which f'(x) is positive cuf negative, as- suming that Figure 15 is the graph of f. 41. 16. Determine the intervals on which f is increasing or decreasing, as- suming that Figure 15 is the graph of f'. 43. 17. State whether f (2) and f(4) are local minima or local maxima, as- 45 suming that Figure 15 is the graph of f'. 47 40 5 2 3 FIGURE 15 18. Figure 16 shows the graph of the derivative f' of a function f . Find the critical points of f and determine whether they are local minima, local maxima, or neither. 3/4
Step by Step Solution
There are 3 Steps involved in it

Get step-by-step solutions from verified subject matter experts