

Question: Can you help with this 2 question pls, and give me explaination This table shows sales per employee for the apparel and textile industries in
Can you help with this 2 question pls, and give me explaination
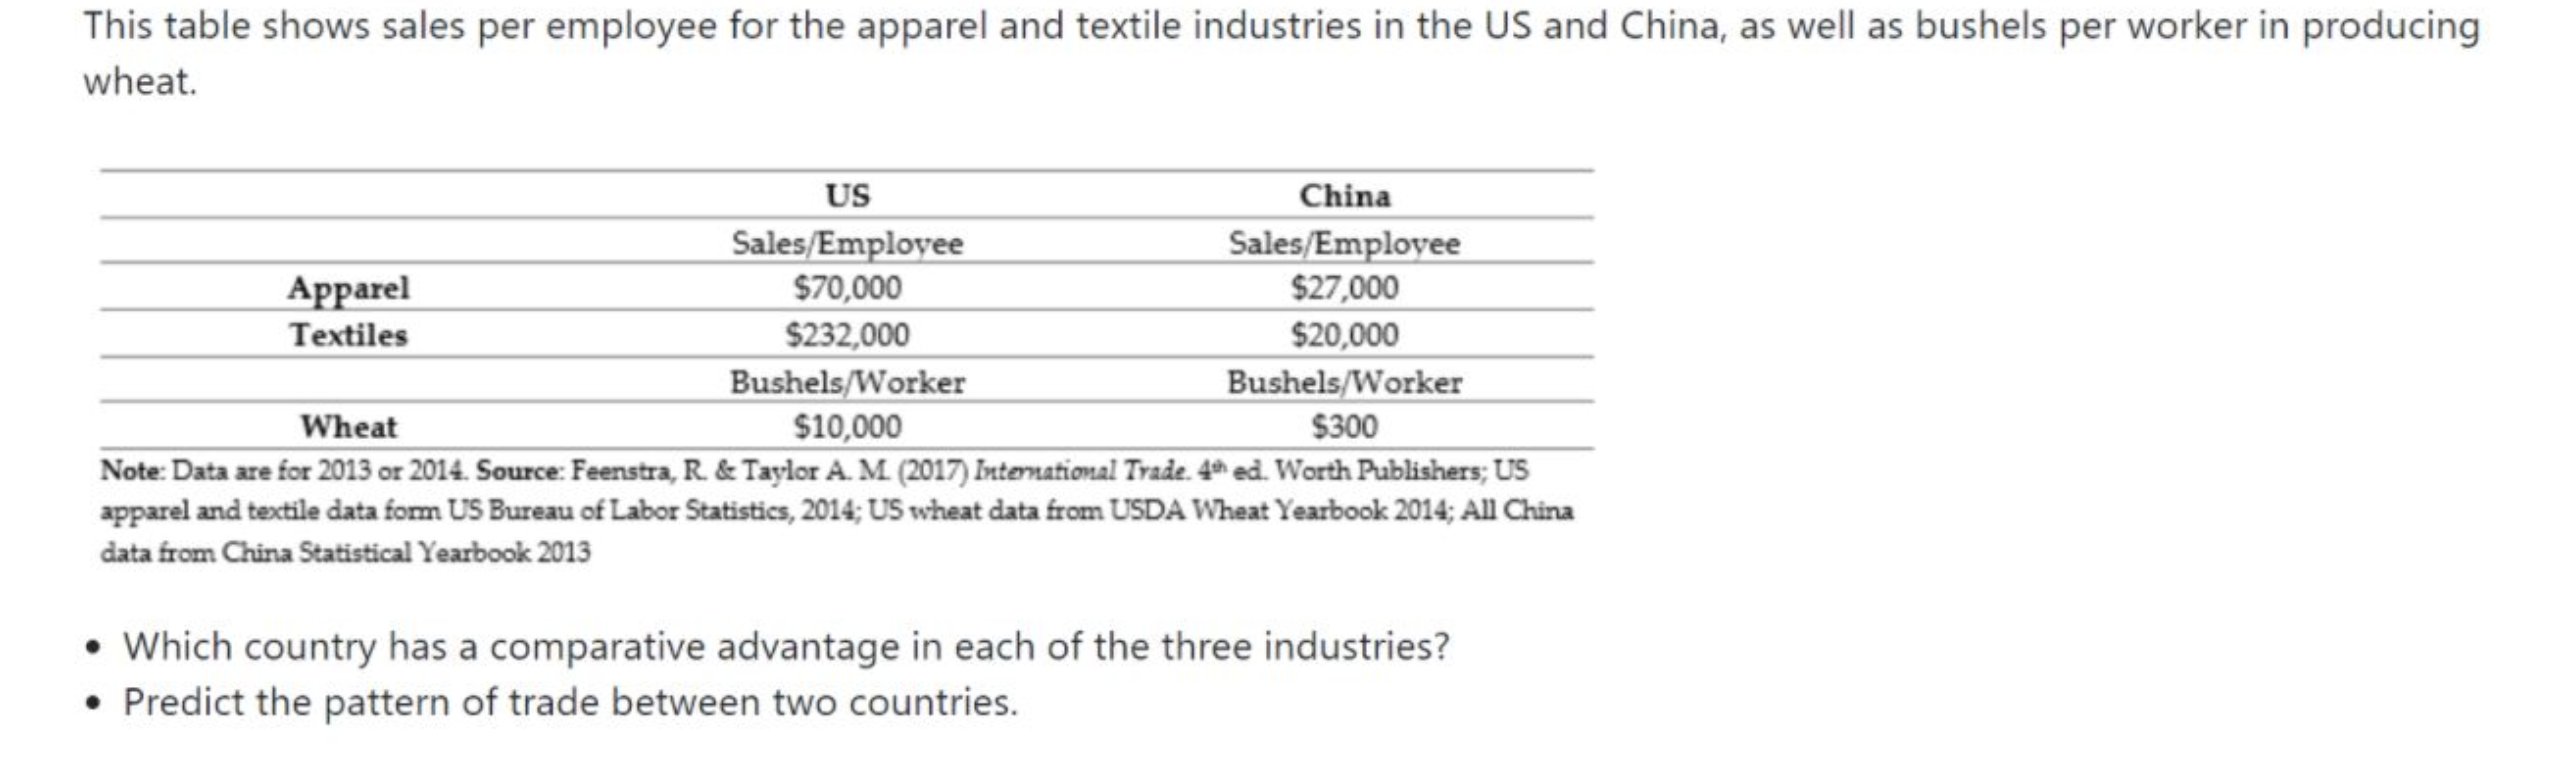
This table shows sales per employee for the apparel and textile industries in the US and China, as well as bushels per worker in producing wheat. US China Sales/Employee Sales/Employee Apparel $70,000 $27,000 Textiles $232,000 $20,000 Bushels/Worker Bushels/Worker Wheat $10,000 $300 Note: Data are for 2013 or 2014. Source: Feenstra, R. & Taylor A. M. (2017) International Trade. 4% ed. Worth Publishers; US apparel and textile data form US Bureau of Labor Statistics, 2014; US wheat data from USDA Wheat Yearbook 2014; All China data from China Statistical Yearbook 2013 . Which country has a comparative advantage in each of the three industries? . Predict the pattern of trade between two countries
Step by Step Solution
There are 3 Steps involved in it

Get step-by-step solutions from verified subject matter experts