

Question: Can you help with this question on statistics and probability. Thank you 4.6 4.7 4.5 4.6 4.7 4.4 4.8 4.3 4.2 4.8 4.7 4.5 4.7
Can you help with this question on statistics and probability. Thank you
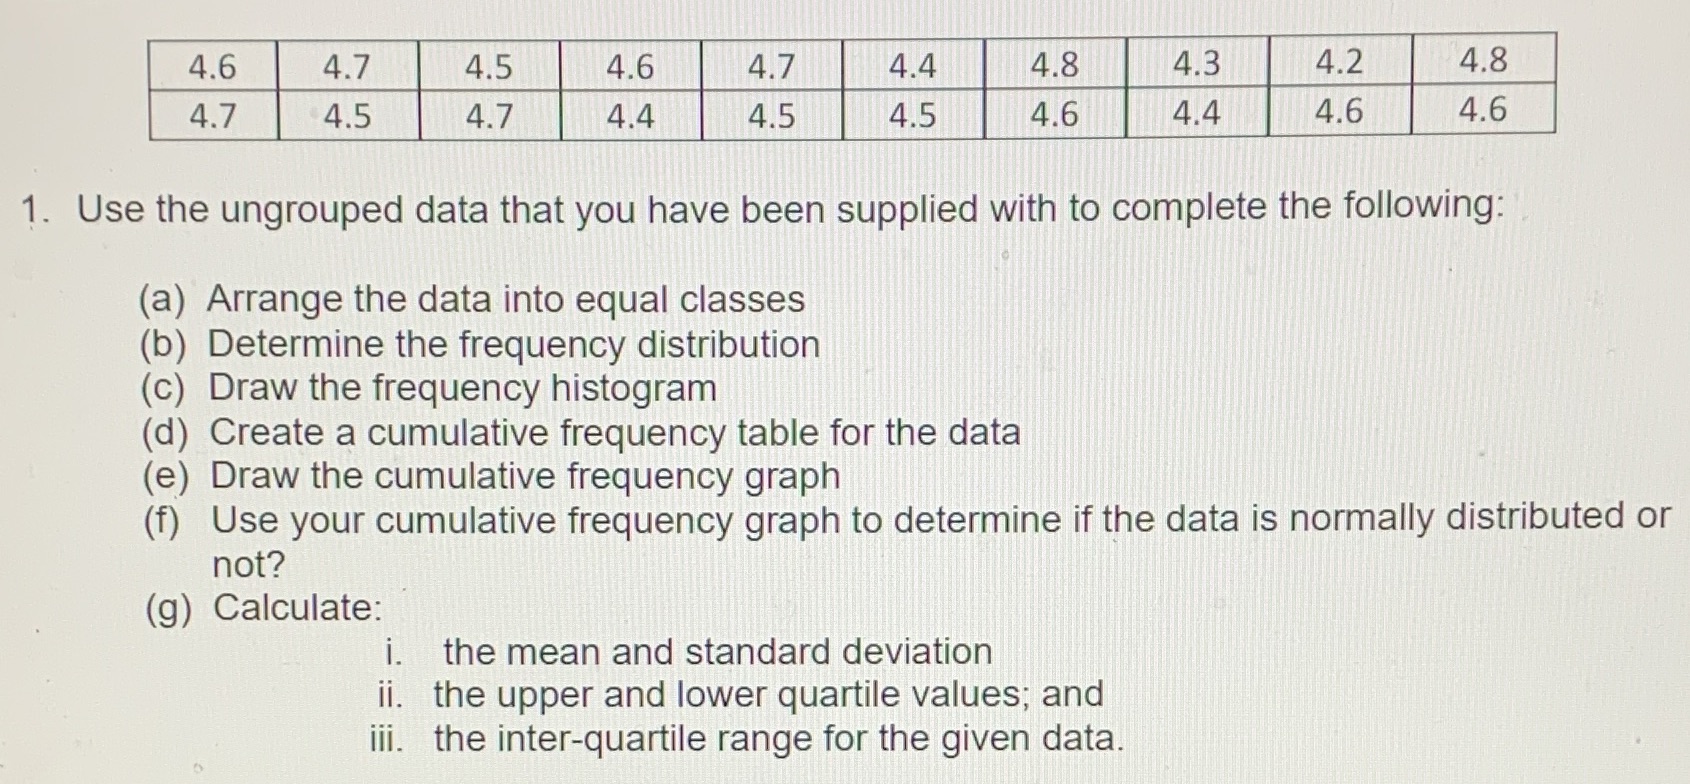
4.6 4.7 4.5 4.6 4.7 4.4 4.8 4.3 4.2 4.8 4.7 4.5 4.7 4.4 4.5 4.5 4.6 4.4 4.6 4.6 1. Use the ungrouped data that you have been supplied with to complete the following: (a) Arrange the data into equal classes (b) Determine the frequency distribution (c) Draw the frequency histogram (d) Create a cumulative frequency table for the data (e) Draw the cumulative frequency graph (f ) Use your cumulative frequency graph to determine if the data is normally distributed or not? (g) Calculate: i. the mean and standard deviation ii. the upper and lower quartile values; and iii. the inter-quartile range for the given data
Step by Step Solution
There are 3 Steps involved in it

Get step-by-step solutions from verified subject matter experts