

Question: can you let me know below you have a data file Watershed is a media services company that provides online streaming movie and television content.
can you let me know
below you have a data file
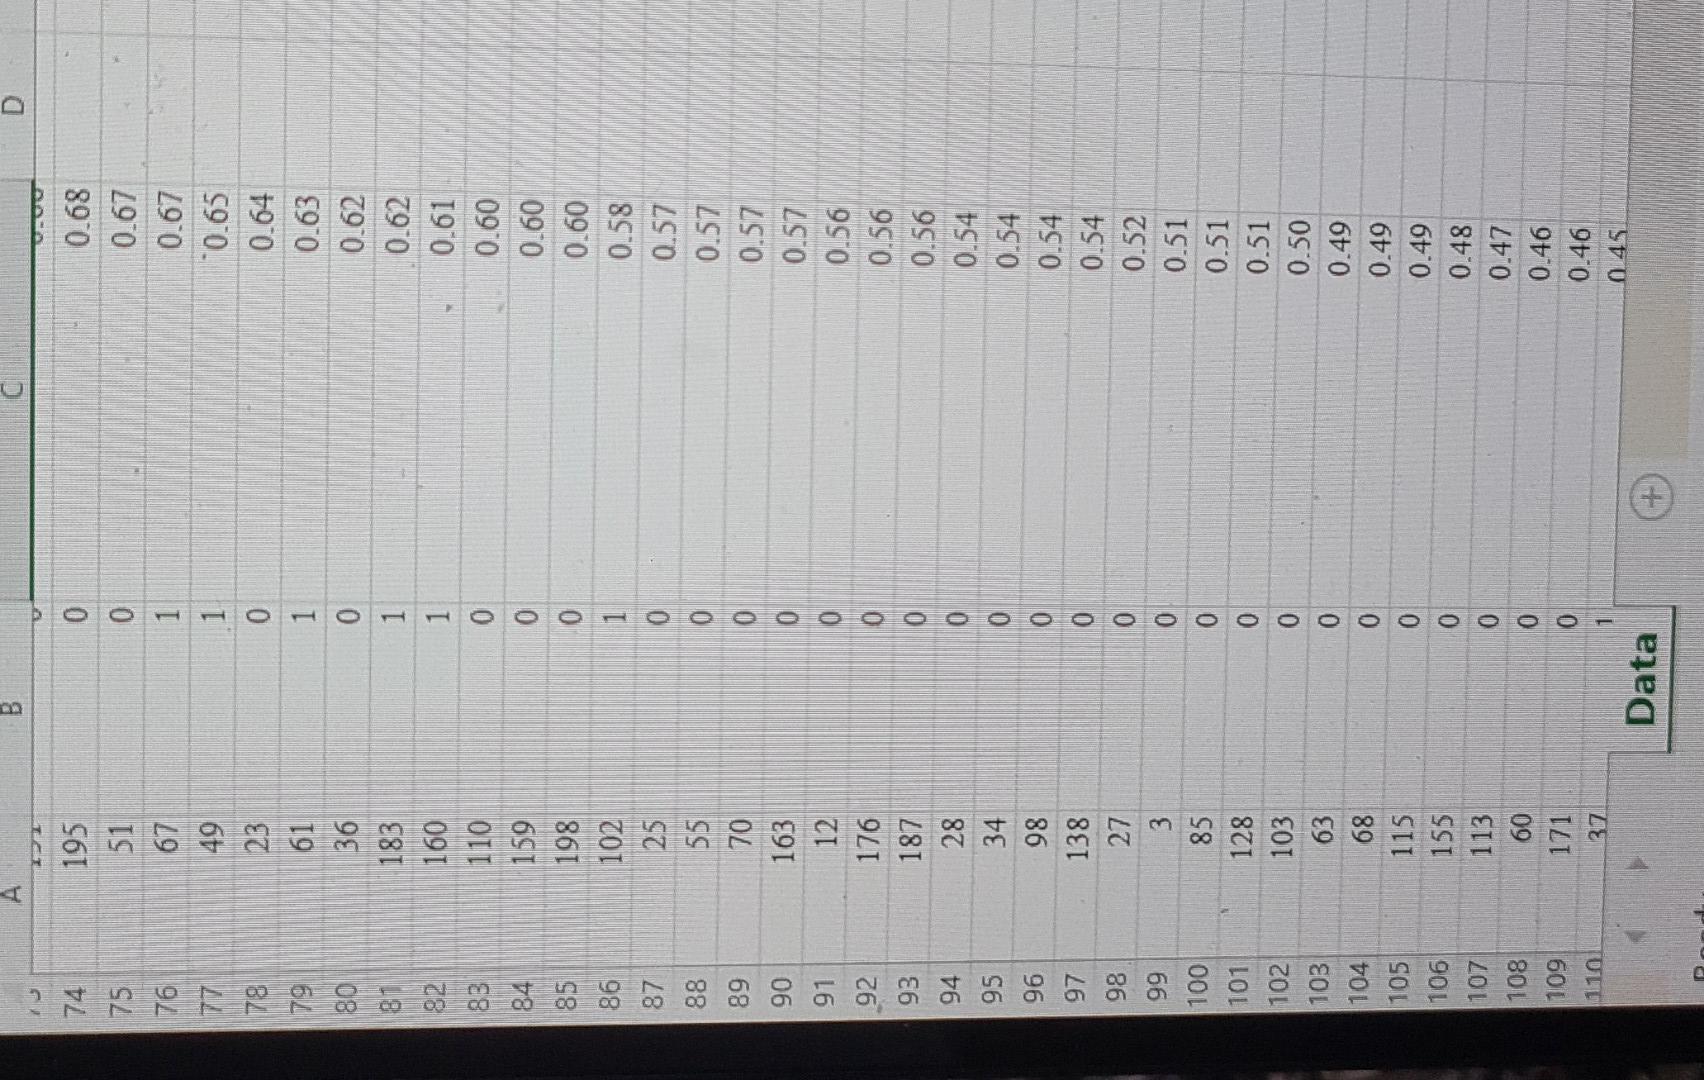
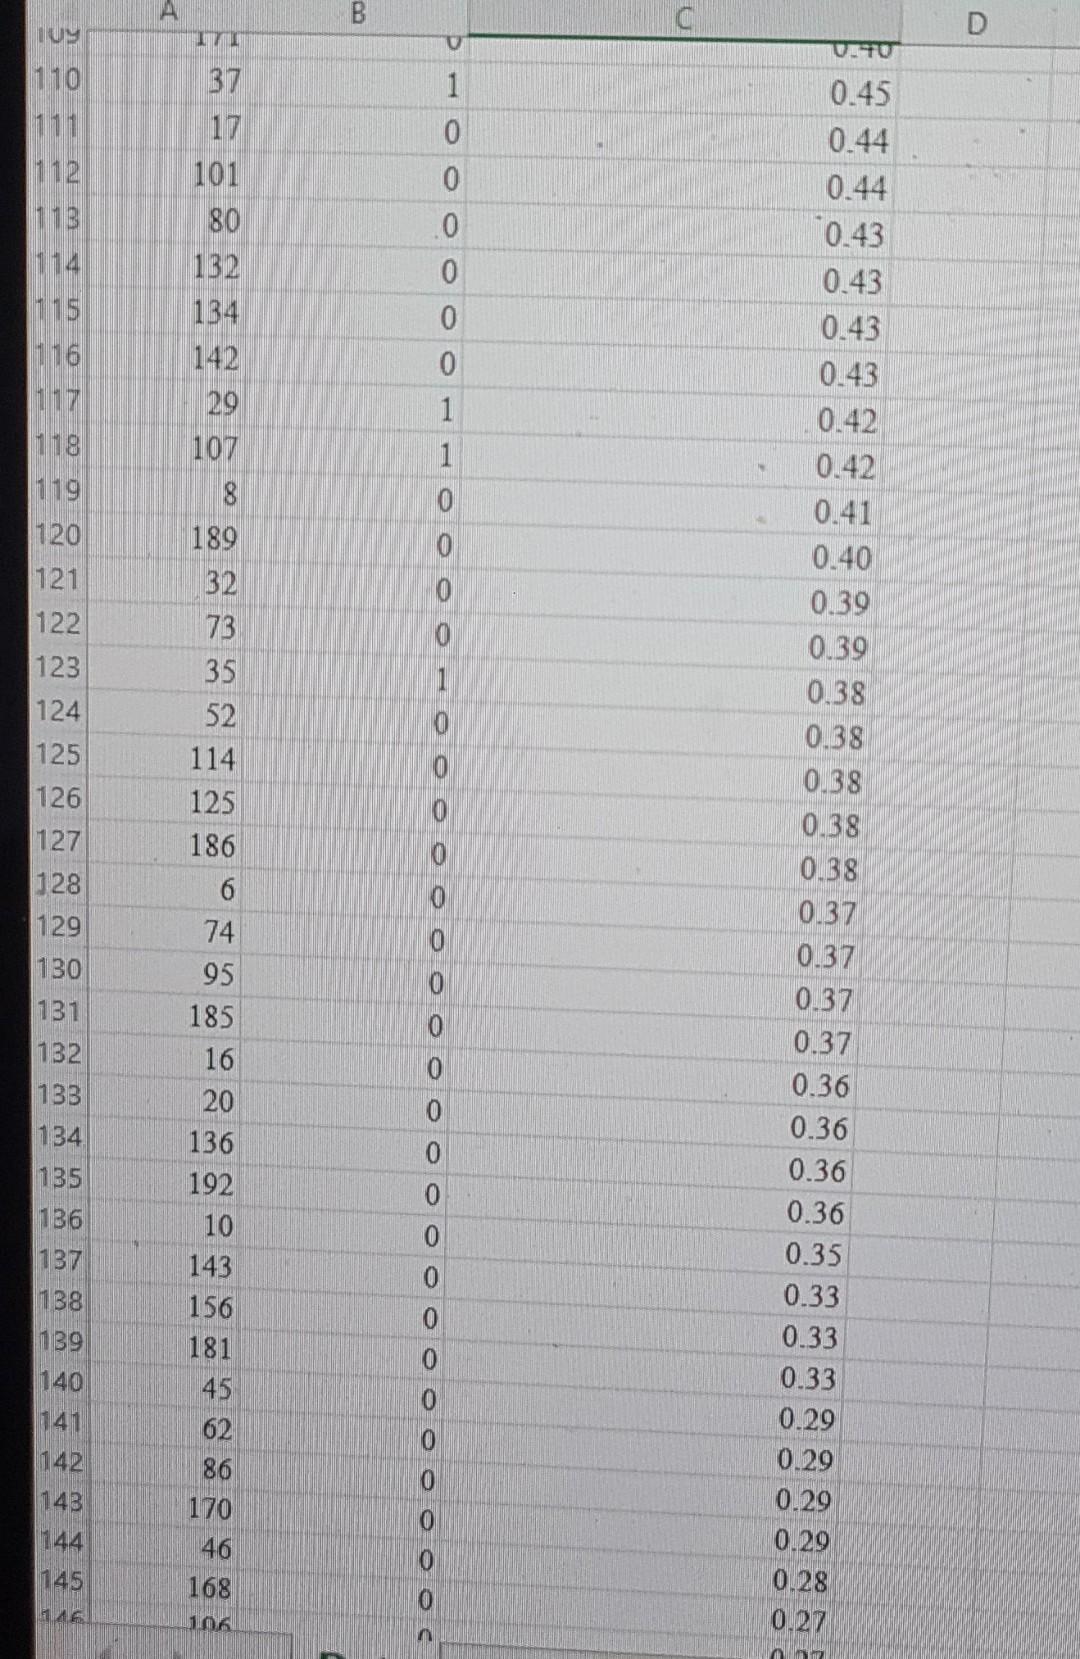
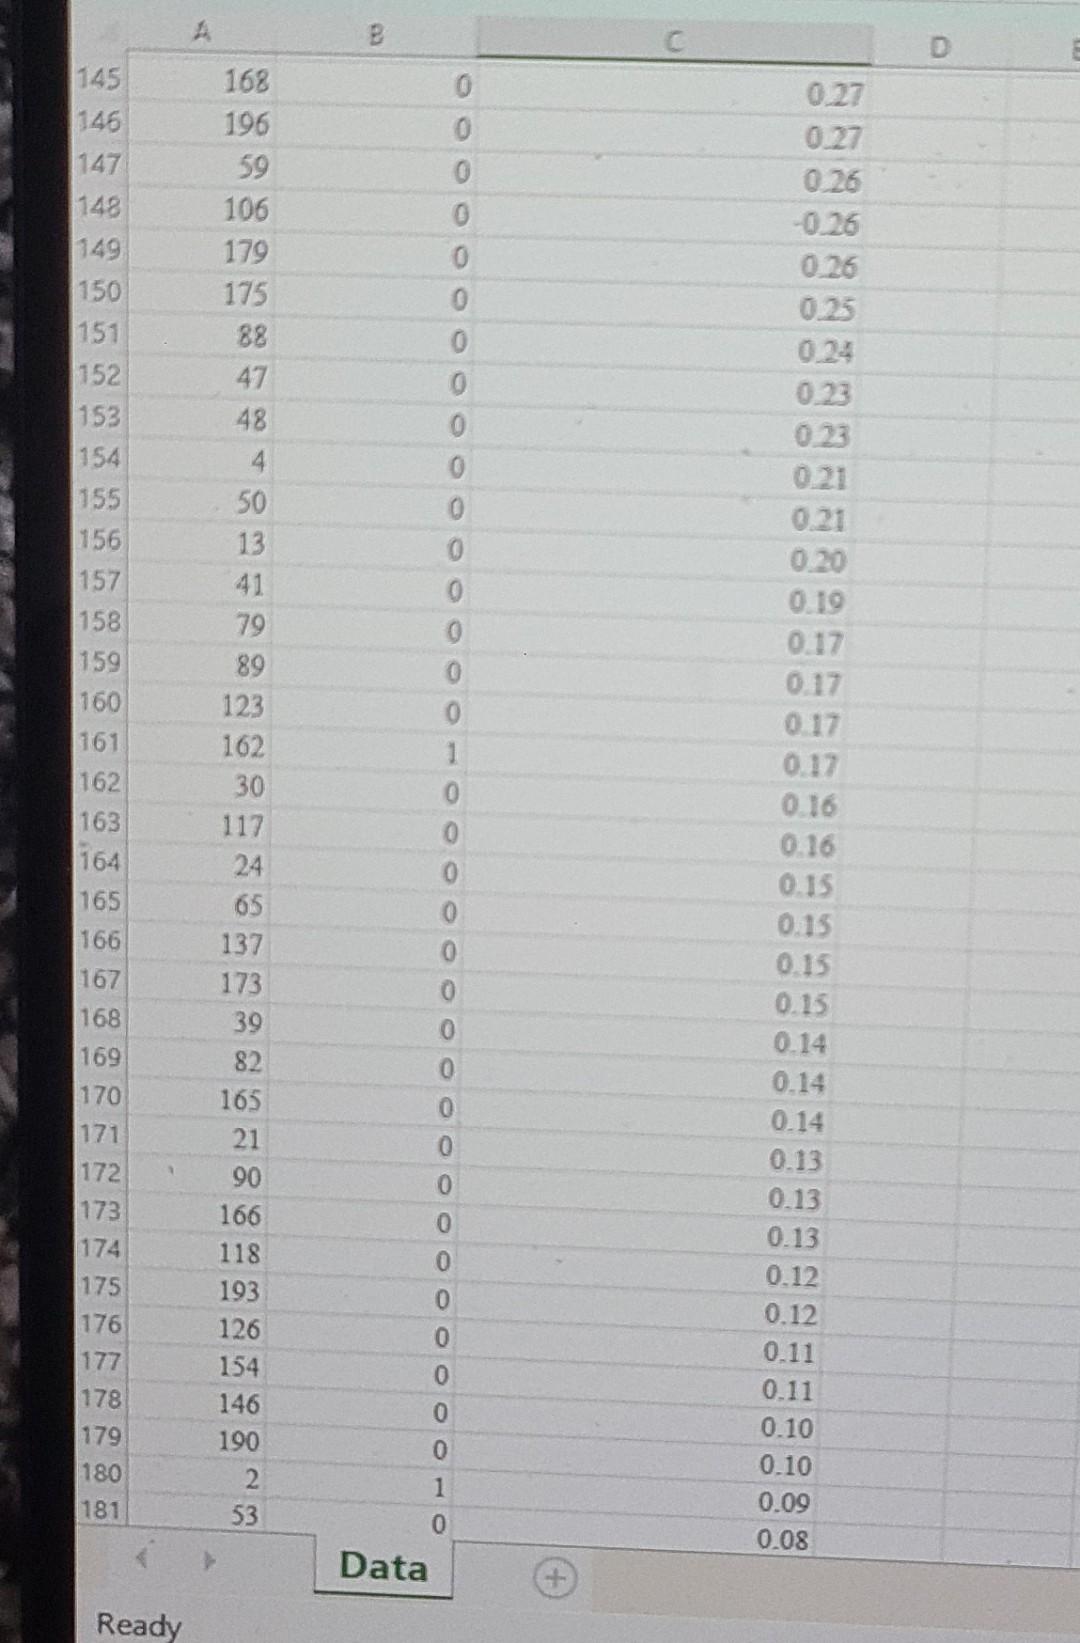
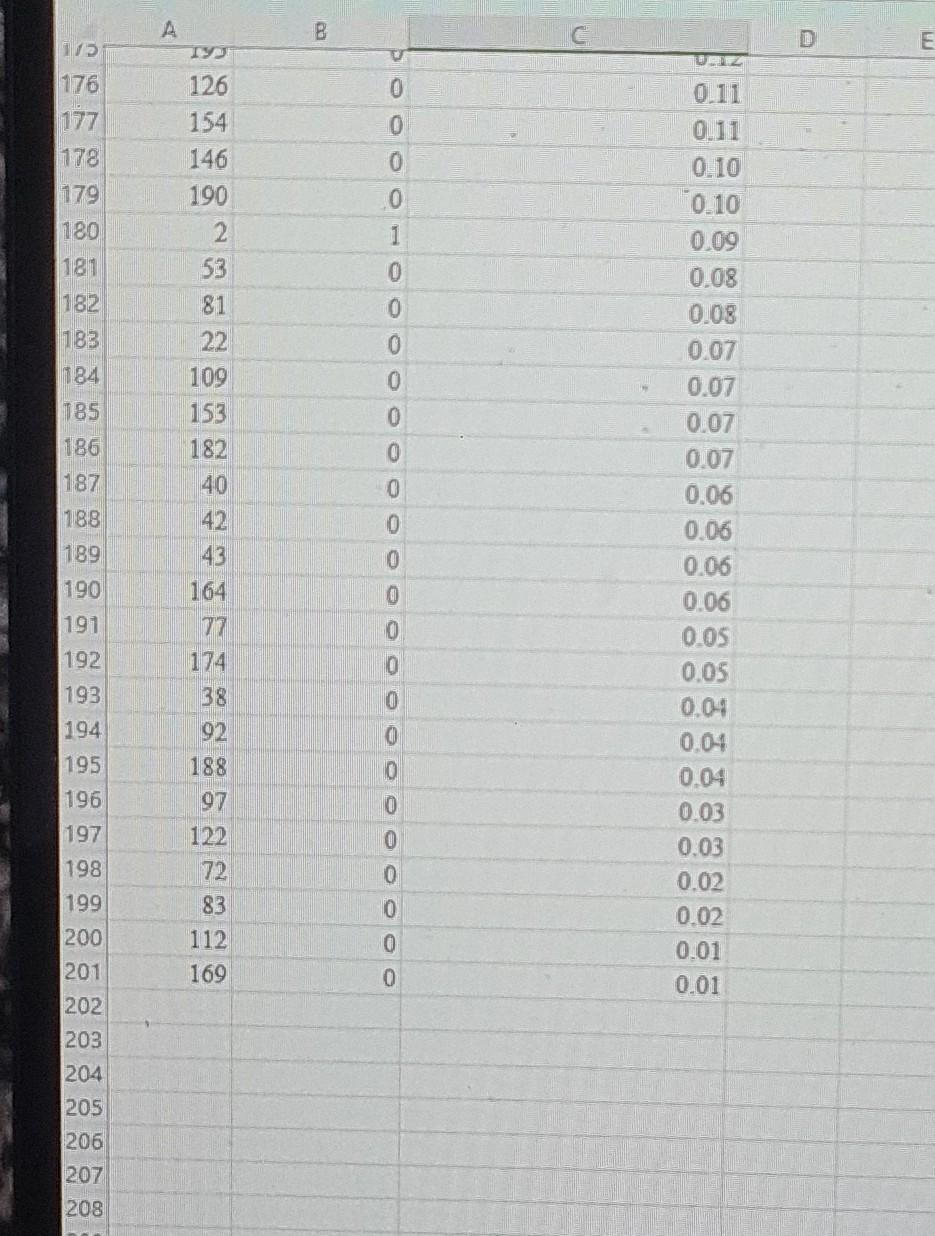
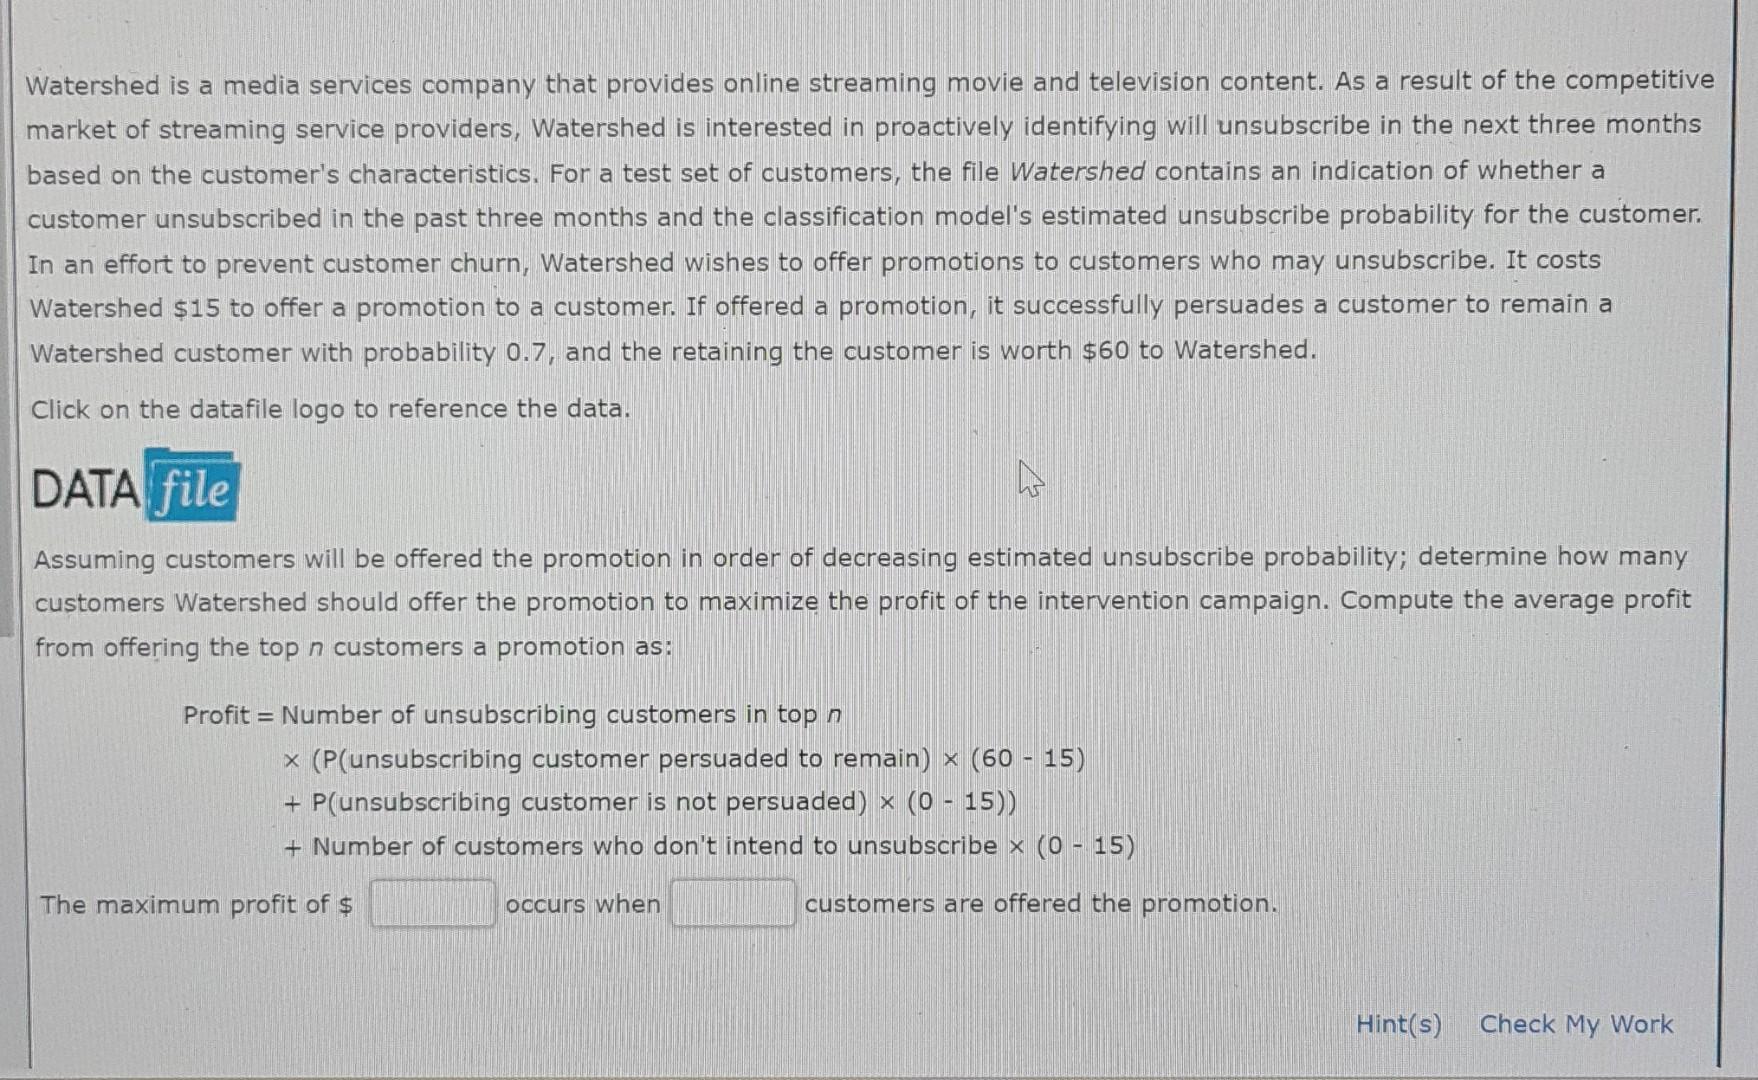
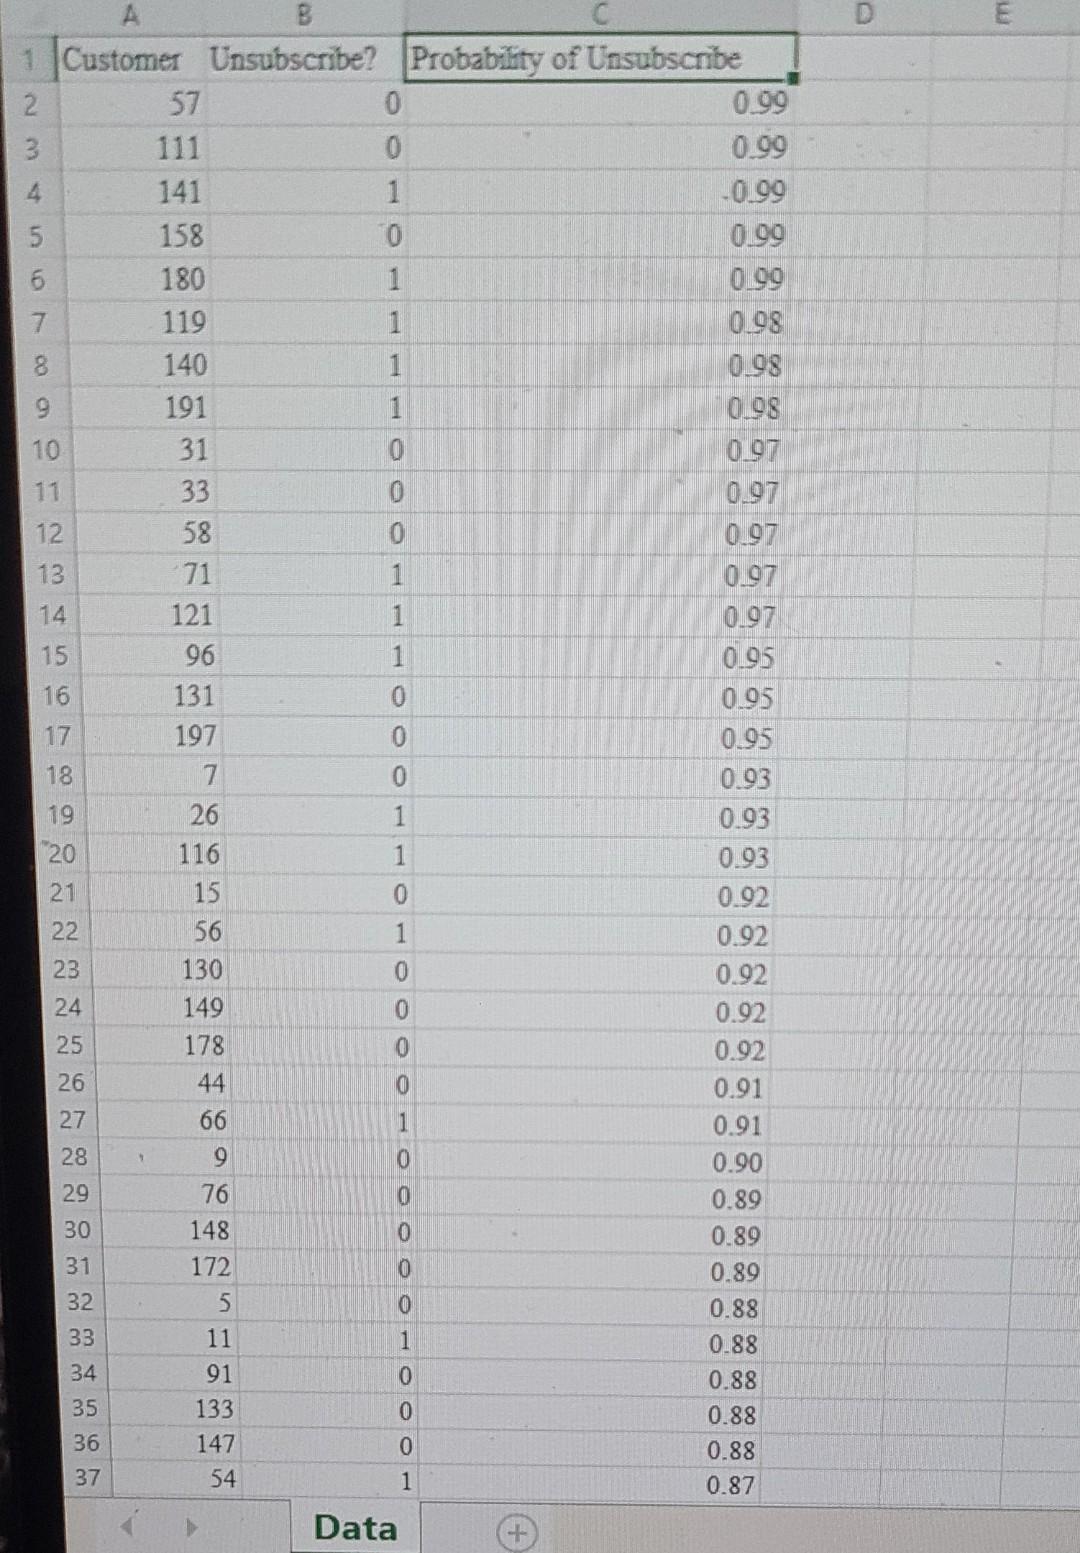
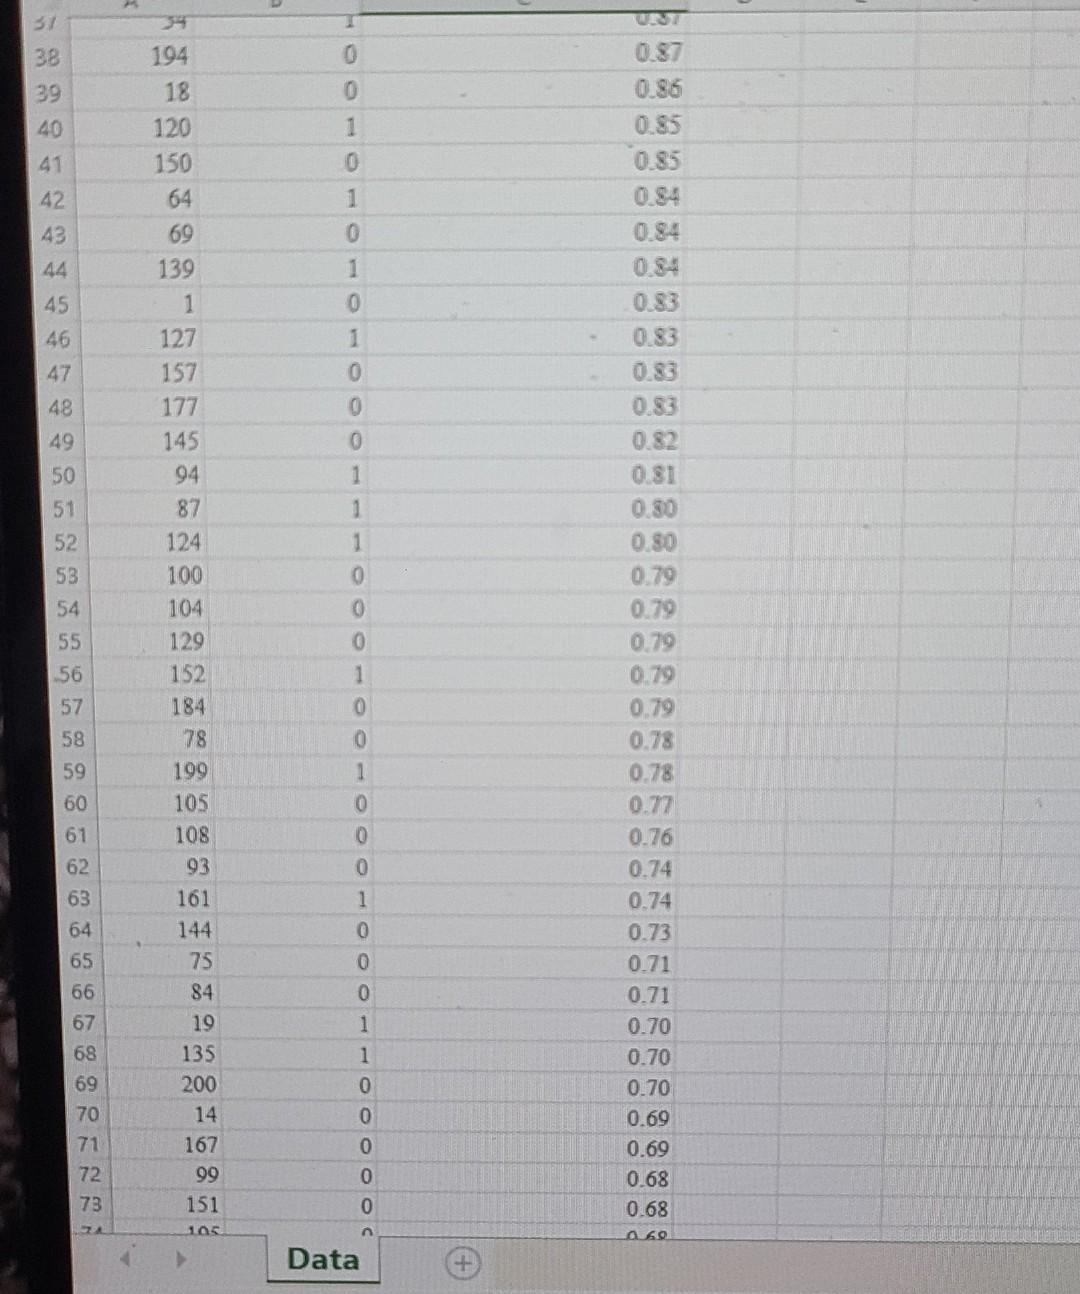
Watershed is a media services company that provides online streaming movie and television content. As a result of the competitive market of streaming service providers, Watershed is interested in proactively identifying will unsubscribe in the next three months based on the customer's characteristics. For a test set of customers, the file Watershed contains an indication of whether a customer unsubscribed in the past three months and the classification model's estimated unsubscribe probability for the customer. In an effort to prevent customer churn, Watershed wishes to offer promotions to customers who may unsubscribe. It costs Watershed $15 to offer a promotion to a customer. If offered a promotion, it successfully persuades a customer to remain a Watershed customer with probability 0.7, and the retaining the customer is worth $60 to Watershed. Click on the datafile logo to reference the data. DATA Assuming customers will be offered the promotion in order of decreasing estimated unsubscribe probability; determine how many customers Watershed should offer the promotion to maximize the profit of the intervention campaign. Compute the average profit from offering the top n customers a promotion as: Profit = Number of unsubscribing customers in top n (P (unsubscribing customer persuaded to remain )(6015) +P (unsubscribing customer is not persuaded) (015)) + Number of customers who don't intend to unsubscribe (015) The maximum profit of $ occurs when customers are offered the promotion. \begin{tabular}{|r|rr} \hline 38 & 194 & 0 \\ \hline 39 & 18 & 0 \\ \hline 40 & 120 & 1 \\ \hline 41 & 150 & 0 \\ \hline 42 & 64 & 1 \\ \hline 43 & 69 & 0 \\ \hline 44 & 139 & 1 \\ 45 & 1 & 0 \\ \hline 46 & 127 & 1 \\ 47 & 157 & 0 \\ \hline 48 & 177 & 0 \\ 49 & 145 & 0 \\ 50 & 94 & 1 \\ \hline 51 & 87 & 1 \\ 52 & 124 & 1 \\ 53 & 100 & 0 \\ 54 & 104 & 0 \\ 55 & 129 & 0 \\ 56 & 152 & 1 \\ 57 & 184 & 0 \\ 58 & 78 & 0 \\ 59 & 199 & 1 \\ 60 & 105 & 0 \\ 61 & 108 & 0 \\ 62 & 93 & 0 \\ 63 & 161 & 1 \\ 64 & 144 & 0 \\ 65 & 75 & 0 \\ 66 & 84 & 0 \\ 67 & 19 & 1 \\ 68 & 135 & 1 \\ 69 & 200 & 0 \\ 70 & 14 & 0 \\ 771 & 167 & 0 \\ 72 & 99 & 0 \\ 77 & 151 & 0 \\ \hline 72 & 105 & 0 \\ \hline & > & Data \\ \hline \end{tabular} Ready Watershed is a media services company that provides online streaming movie and television content. As a result of the competitive market of streaming service providers, Watershed is interested in proactively identifying will unsubscribe in the next three months based on the customer's characteristics. For a test set of customers, the file Watershed contains an indication of whether a customer unsubscribed in the past three months and the classification model's estimated unsubscribe probability for the customer. In an effort to prevent customer churn, Watershed wishes to offer promotions to customers who may unsubscribe. It costs Watershed $15 to offer a promotion to a customer. If offered a promotion, it successfully persuades a customer to remain a Watershed customer with probability 0.7, and the retaining the customer is worth $60 to Watershed. Click on the datafile logo to reference the data. DATA Assuming customers will be offered the promotion in order of decreasing estimated unsubscribe probability; determine how many customers Watershed should offer the promotion to maximize the profit of the intervention campaign. Compute the average profit from offering the top n customers a promotion as: Profit = Number of unsubscribing customers in top n (P (unsubscribing customer persuaded to remain )(6015) +P (unsubscribing customer is not persuaded) (015)) + Number of customers who don't intend to unsubscribe (015) The maximum profit of $ occurs when customers are offered the promotion. \begin{tabular}{|r|rr} \hline 38 & 194 & 0 \\ \hline 39 & 18 & 0 \\ \hline 40 & 120 & 1 \\ \hline 41 & 150 & 0 \\ \hline 42 & 64 & 1 \\ \hline 43 & 69 & 0 \\ \hline 44 & 139 & 1 \\ 45 & 1 & 0 \\ \hline 46 & 127 & 1 \\ 47 & 157 & 0 \\ \hline 48 & 177 & 0 \\ 49 & 145 & 0 \\ 50 & 94 & 1 \\ \hline 51 & 87 & 1 \\ 52 & 124 & 1 \\ 53 & 100 & 0 \\ 54 & 104 & 0 \\ 55 & 129 & 0 \\ 56 & 152 & 1 \\ 57 & 184 & 0 \\ 58 & 78 & 0 \\ 59 & 199 & 1 \\ 60 & 105 & 0 \\ 61 & 108 & 0 \\ 62 & 93 & 0 \\ 63 & 161 & 1 \\ 64 & 144 & 0 \\ 65 & 75 & 0 \\ 66 & 84 & 0 \\ 67 & 19 & 1 \\ 68 & 135 & 1 \\ 69 & 200 & 0 \\ 70 & 14 & 0 \\ 771 & 167 & 0 \\ 72 & 99 & 0 \\ 77 & 151 & 0 \\ \hline 72 & 105 & 0 \\ \hline & > & Data \\ \hline \end{tabular} Ready
Step by Step Solution
There are 3 Steps involved in it

Get step-by-step solutions from verified subject matter experts