

Question: CAN YOU MAKE IT STEP BY STEP USING EXCEL PLEASE.. 10. Praniali also needs to calculate the income from insurance reimbursements in the years 2023-2025.
CAN YOU MAKE IT STEP BY STEP USING EXCEL PLEASE..
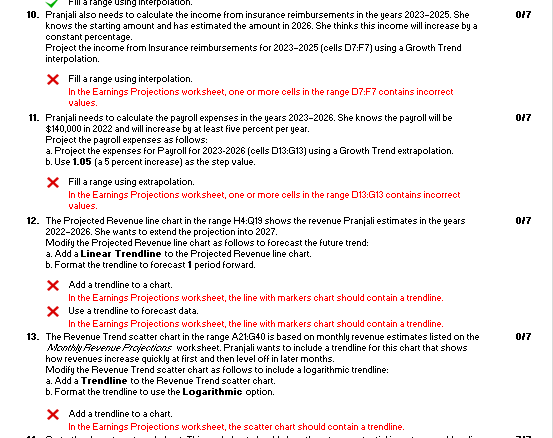
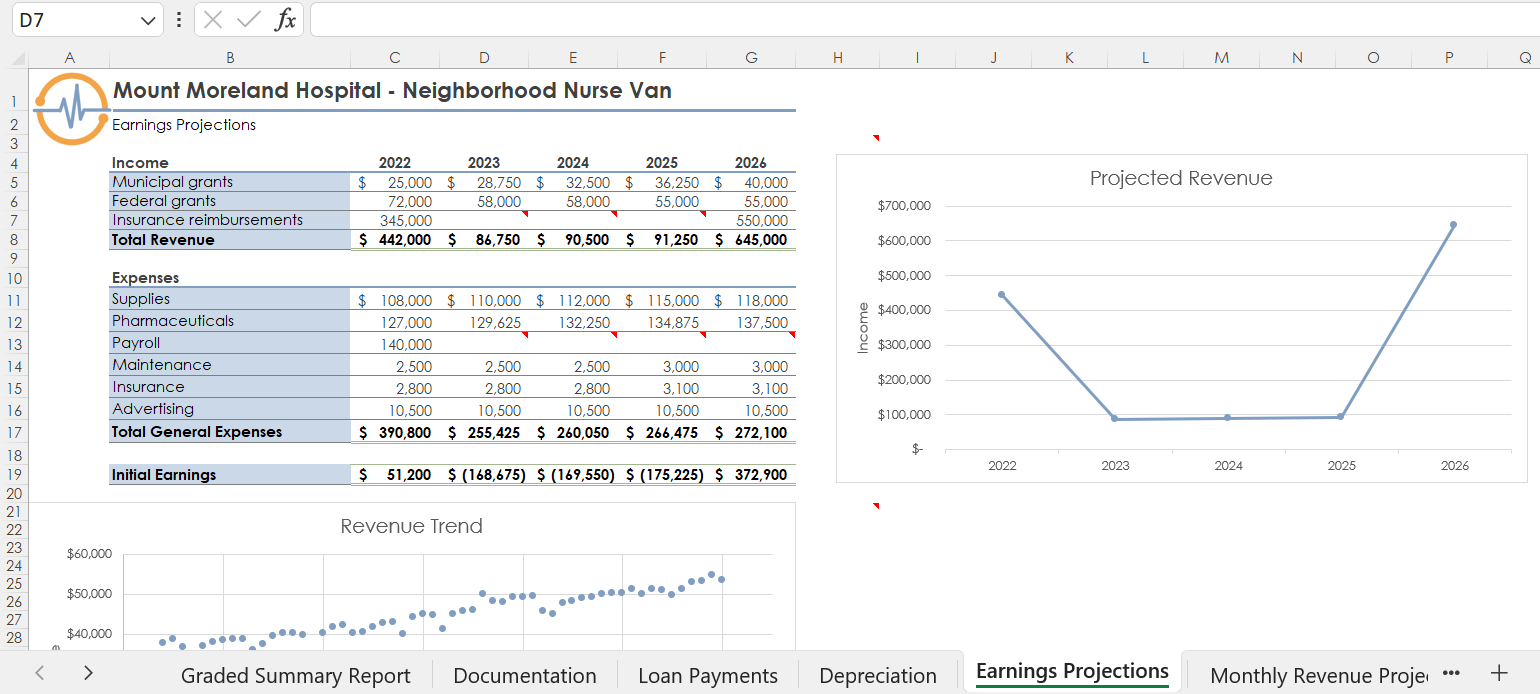
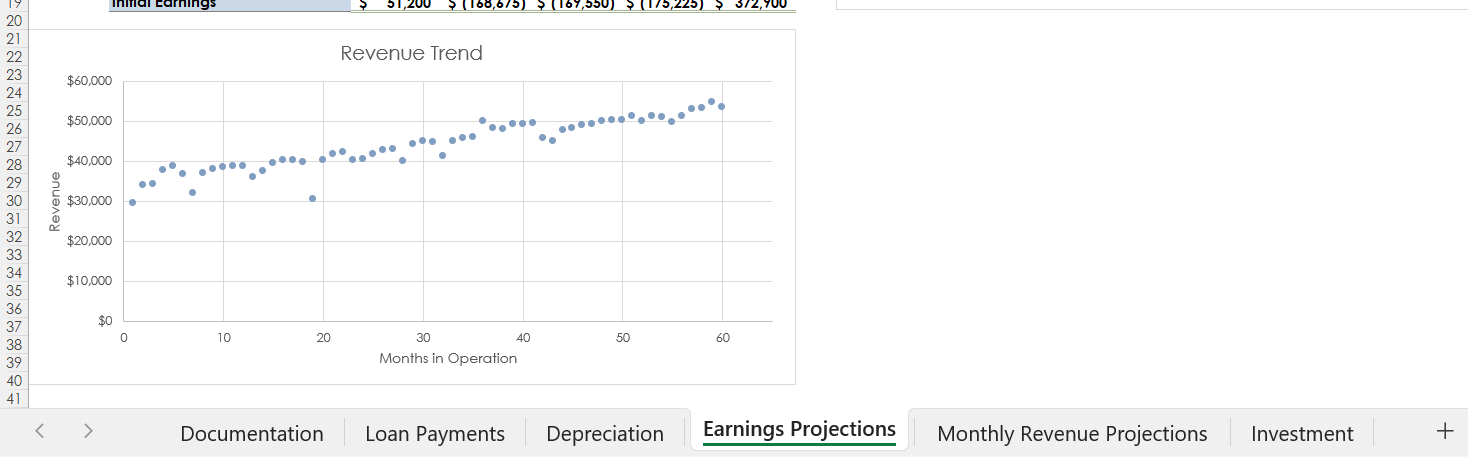
10. Praniali also needs to calculate the income from insurance reimbursements in the years 2023-2025. She 017 knows the starting amount and has estimated the amount in 2026 . She thinks this income will increase by a constant percentage. Project the income from Insurance reimbursements for 2023-2025 (cells D7:F7) using a Growth Trend interpolation. Fill a range using interpolation. In the Earnings Projections worksheet, one or more cells in the range D7F7 contains incorrect values. 11. Praniali needs to calculate the payroll expenses in the years 20232026. She knows the payroll will be $140,000 in 2022 and will increase by at least five percent per year. 017 Project the payroll expenses as follows: a. Project the expenses for Payroll for 2023-2026 (cells D13:G13) using a Growth Trend extrapolation. b. Use 1.05 (a 5 percent increase) as the step value. Fill a range using extrapolation. In the Earnings Projections worksheet, one or more cells in the range D13:Gi13 contains incorrect values. 12. The Projected Revenue line chart in the range H4:Q19 shows the revenue Pranjali estimates in the years 017 2022-2026. She wants to extend the projection into 2027. Modify the Projected Revenue line chart as follows to forecast the future trend: a. Add a Linear Trendline to the Projected Revenue line chart. b. Format the trendline to forecast 1 period forward. Add a trendine to a chart. In the Earnings Projections worksheet, the line with markers chart should contain a trendline. Use a trendine to forecast data. In the Earnings Projections worksheet, the line with markers chart should contain a trendline. 13. The Revenue Trend scatter chart in the range A.21:G40 is based on monthly revenue estimates listed on the 017 Arowhlewewe Fojections worksheet. Pranjali wants to include a trendline for this chart that shows how revenues increase quickly at first and then level off in later months. Modify the Revenue Trend scatter chart as follows to include a logarithmic trendline: a. Add a Trendline to the Revenue Trend scatter chart. b. Format the trendline to use the Logarithmic option. Add a trendine to a chart. Mount Moreland Hospital - Neighborhood Nurse Van Earnings Projections Revenue Trend 41 10. Praniali also needs to calculate the income from insurance reimbursements in the years 2023-2025. She 017 knows the starting amount and has estimated the amount in 2026 . She thinks this income will increase by a constant percentage. Project the income from Insurance reimbursements for 2023-2025 (cells D7:F7) using a Growth Trend interpolation. Fill a range using interpolation. In the Earnings Projections worksheet, one or more cells in the range D7F7 contains incorrect values. 11. Praniali needs to calculate the payroll expenses in the years 20232026. She knows the payroll will be $140,000 in 2022 and will increase by at least five percent per year. 017 Project the payroll expenses as follows: a. Project the expenses for Payroll for 2023-2026 (cells D13:G13) using a Growth Trend extrapolation. b. Use 1.05 (a 5 percent increase) as the step value. Fill a range using extrapolation. In the Earnings Projections worksheet, one or more cells in the range D13:Gi13 contains incorrect values. 12. The Projected Revenue line chart in the range H4:Q19 shows the revenue Pranjali estimates in the years 017 2022-2026. She wants to extend the projection into 2027. Modify the Projected Revenue line chart as follows to forecast the future trend: a. Add a Linear Trendline to the Projected Revenue line chart. b. Format the trendline to forecast 1 period forward. Add a trendine to a chart. In the Earnings Projections worksheet, the line with markers chart should contain a trendline. Use a trendine to forecast data. In the Earnings Projections worksheet, the line with markers chart should contain a trendline. 13. The Revenue Trend scatter chart in the range A.21:G40 is based on monthly revenue estimates listed on the 017 Arowhlewewe Fojections worksheet. Pranjali wants to include a trendline for this chart that shows how revenues increase quickly at first and then level off in later months. Modify the Revenue Trend scatter chart as follows to include a logarithmic trendline: a. Add a Trendline to the Revenue Trend scatter chart. b. Format the trendline to use the Logarithmic option. Add a trendine to a chart. Mount Moreland Hospital - Neighborhood Nurse Van Earnings Projections Revenue Trend 41
Step by Step Solution
There are 3 Steps involved in it

Get step-by-step solutions from verified subject matter experts