

Question: can you perform a data analysis on excel? for my statistics class. 6 Safari File Edit View History Bookmarks Window Help - Tue8:48 PM Q
- can you perform a data analysis on excel? for my statistics class.
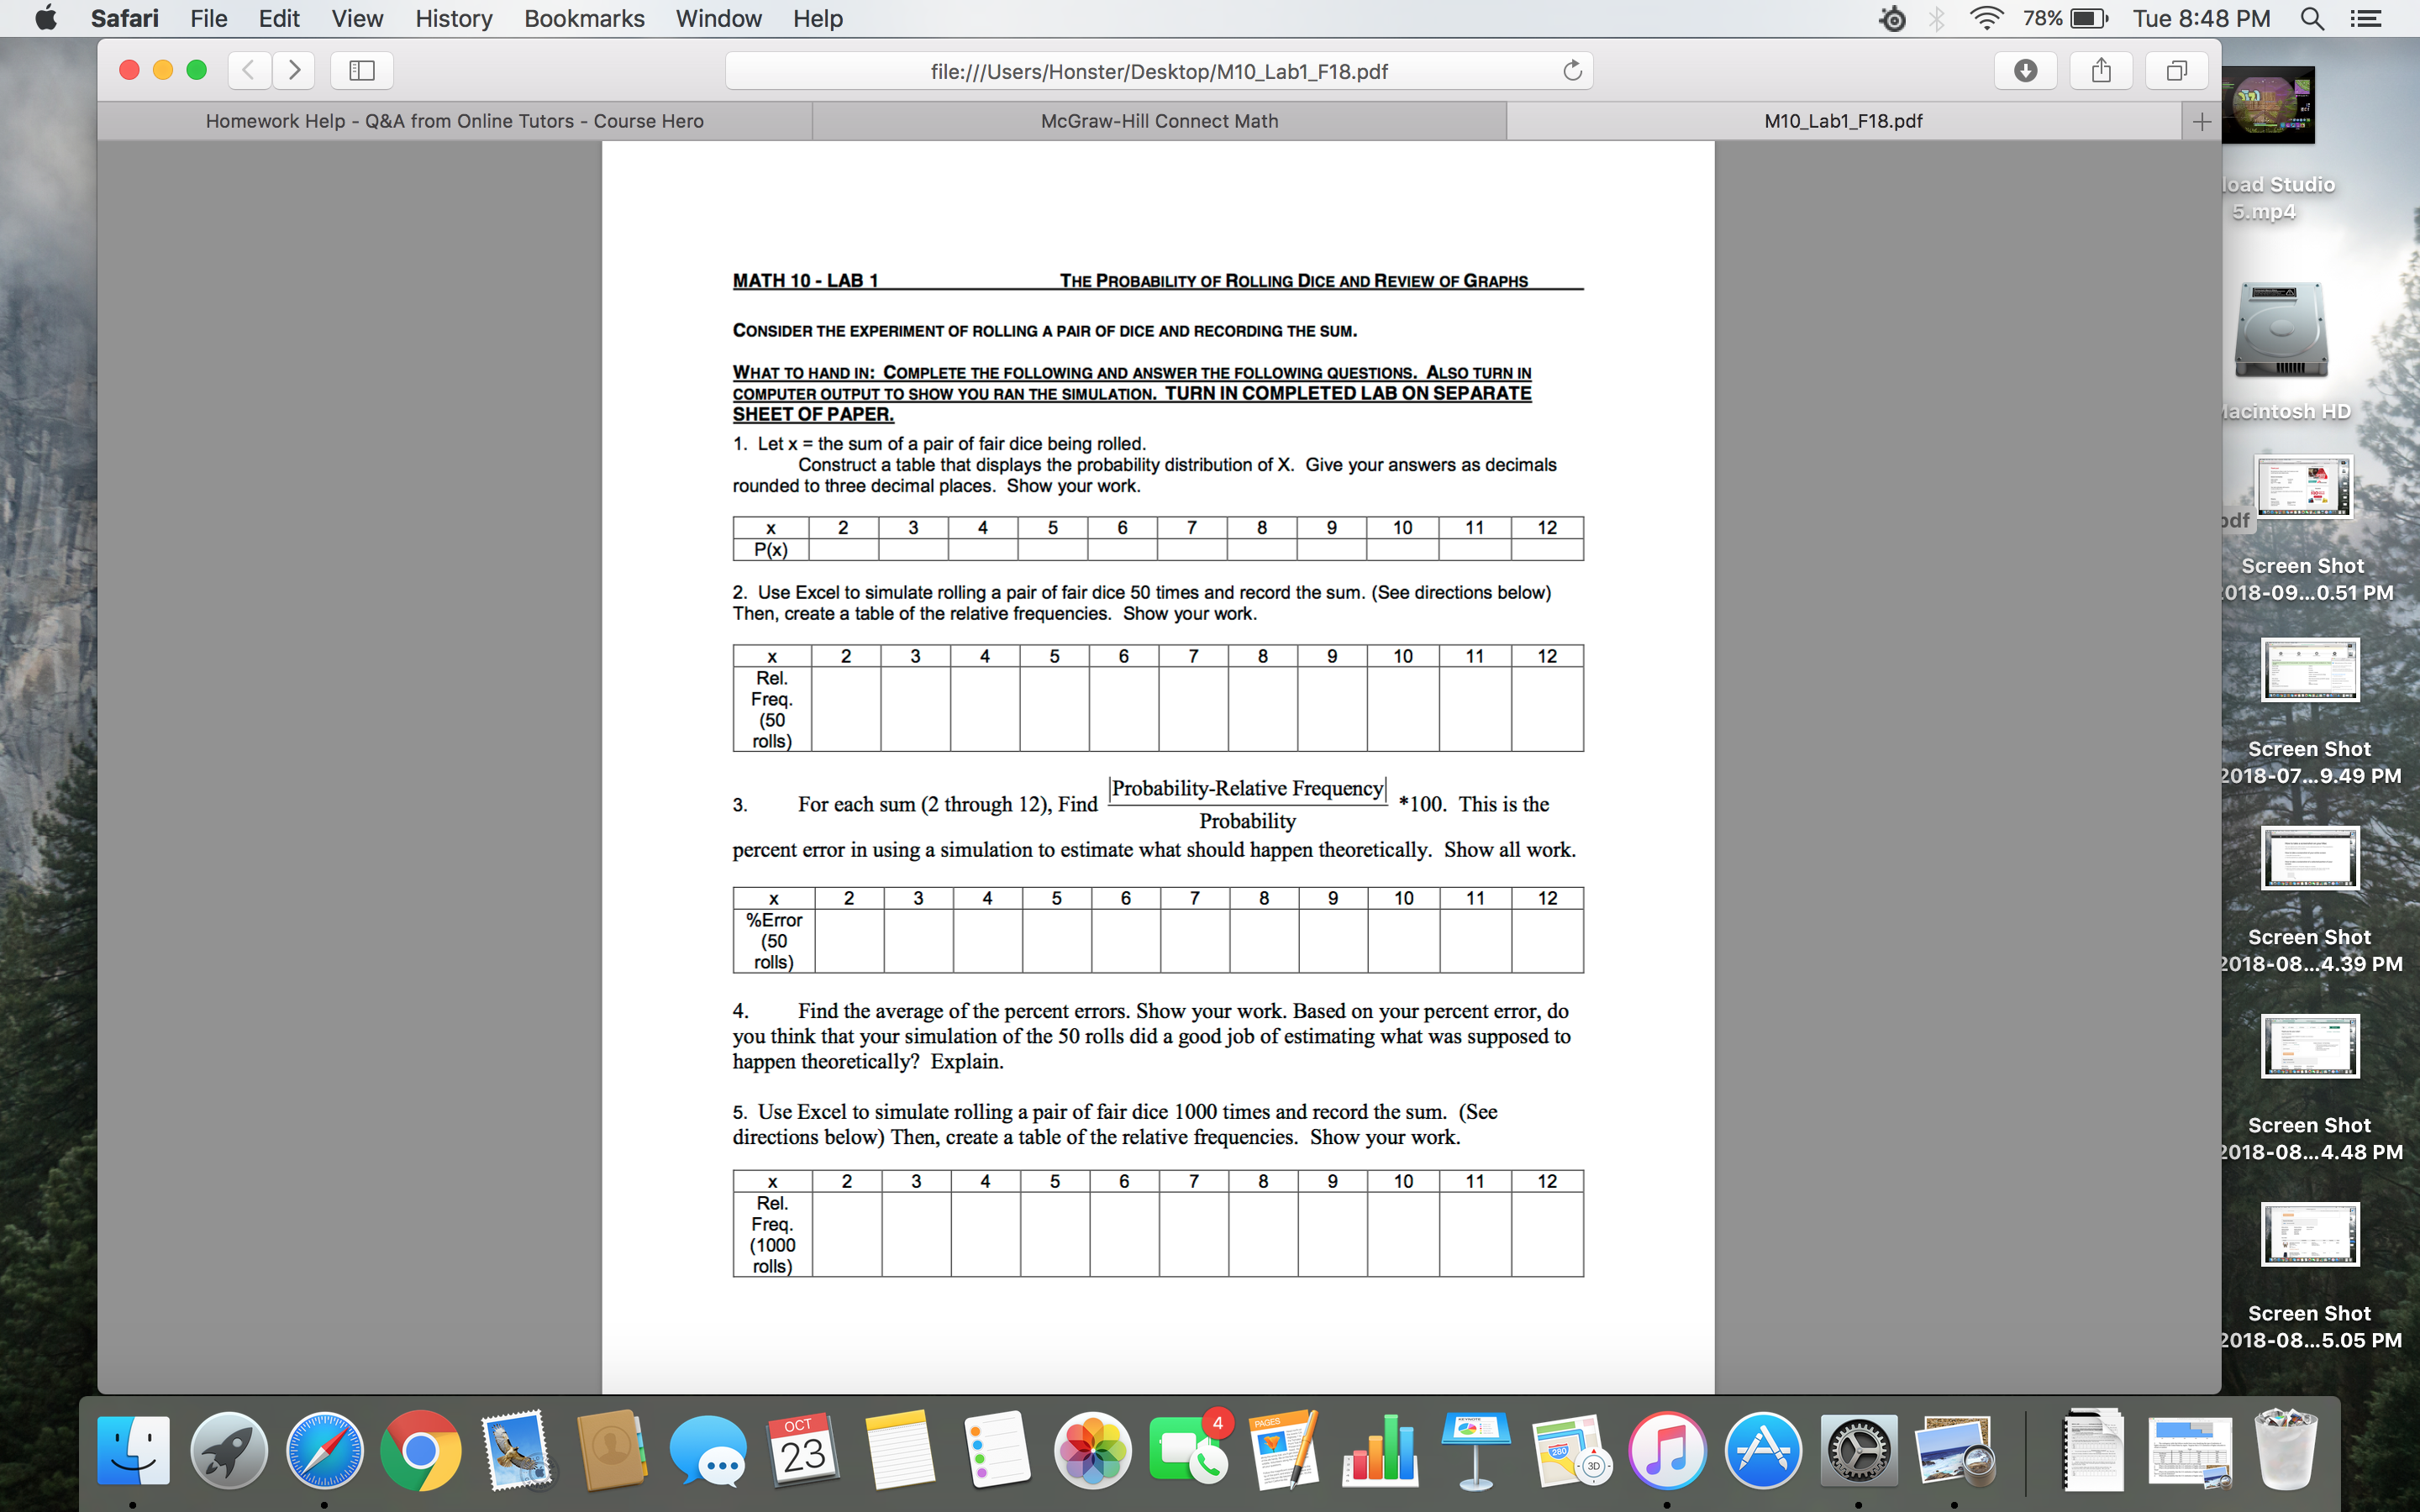
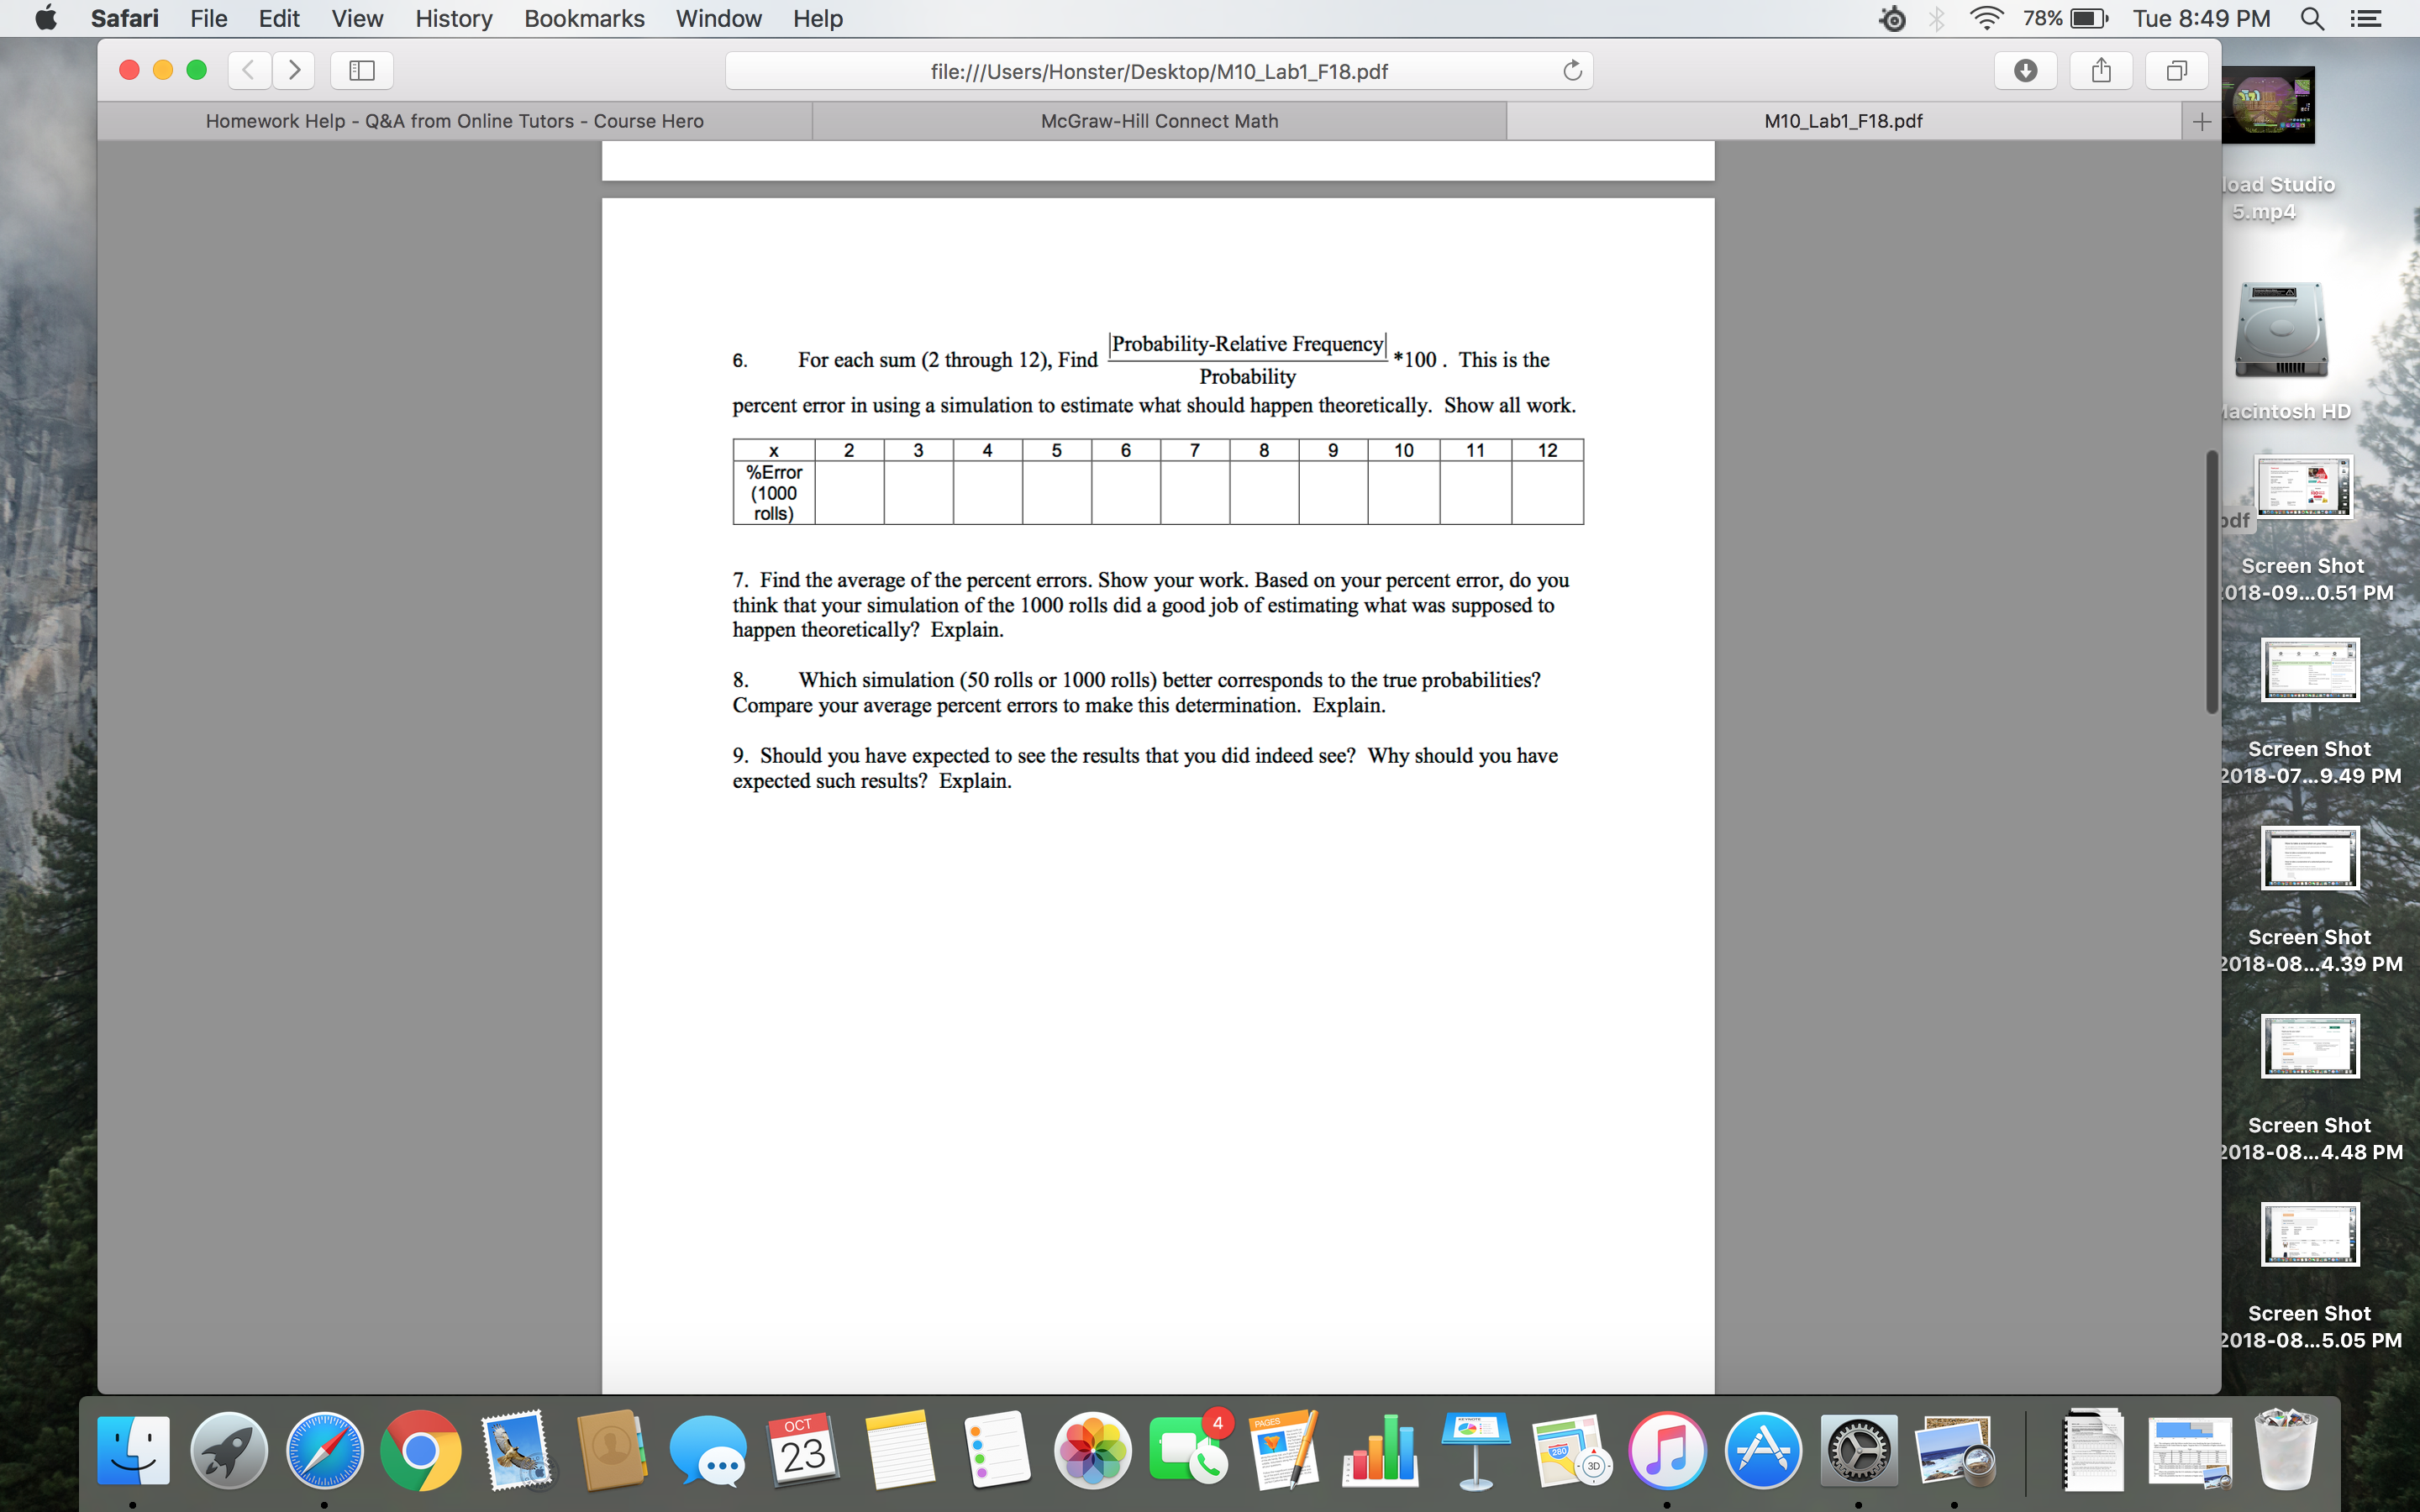
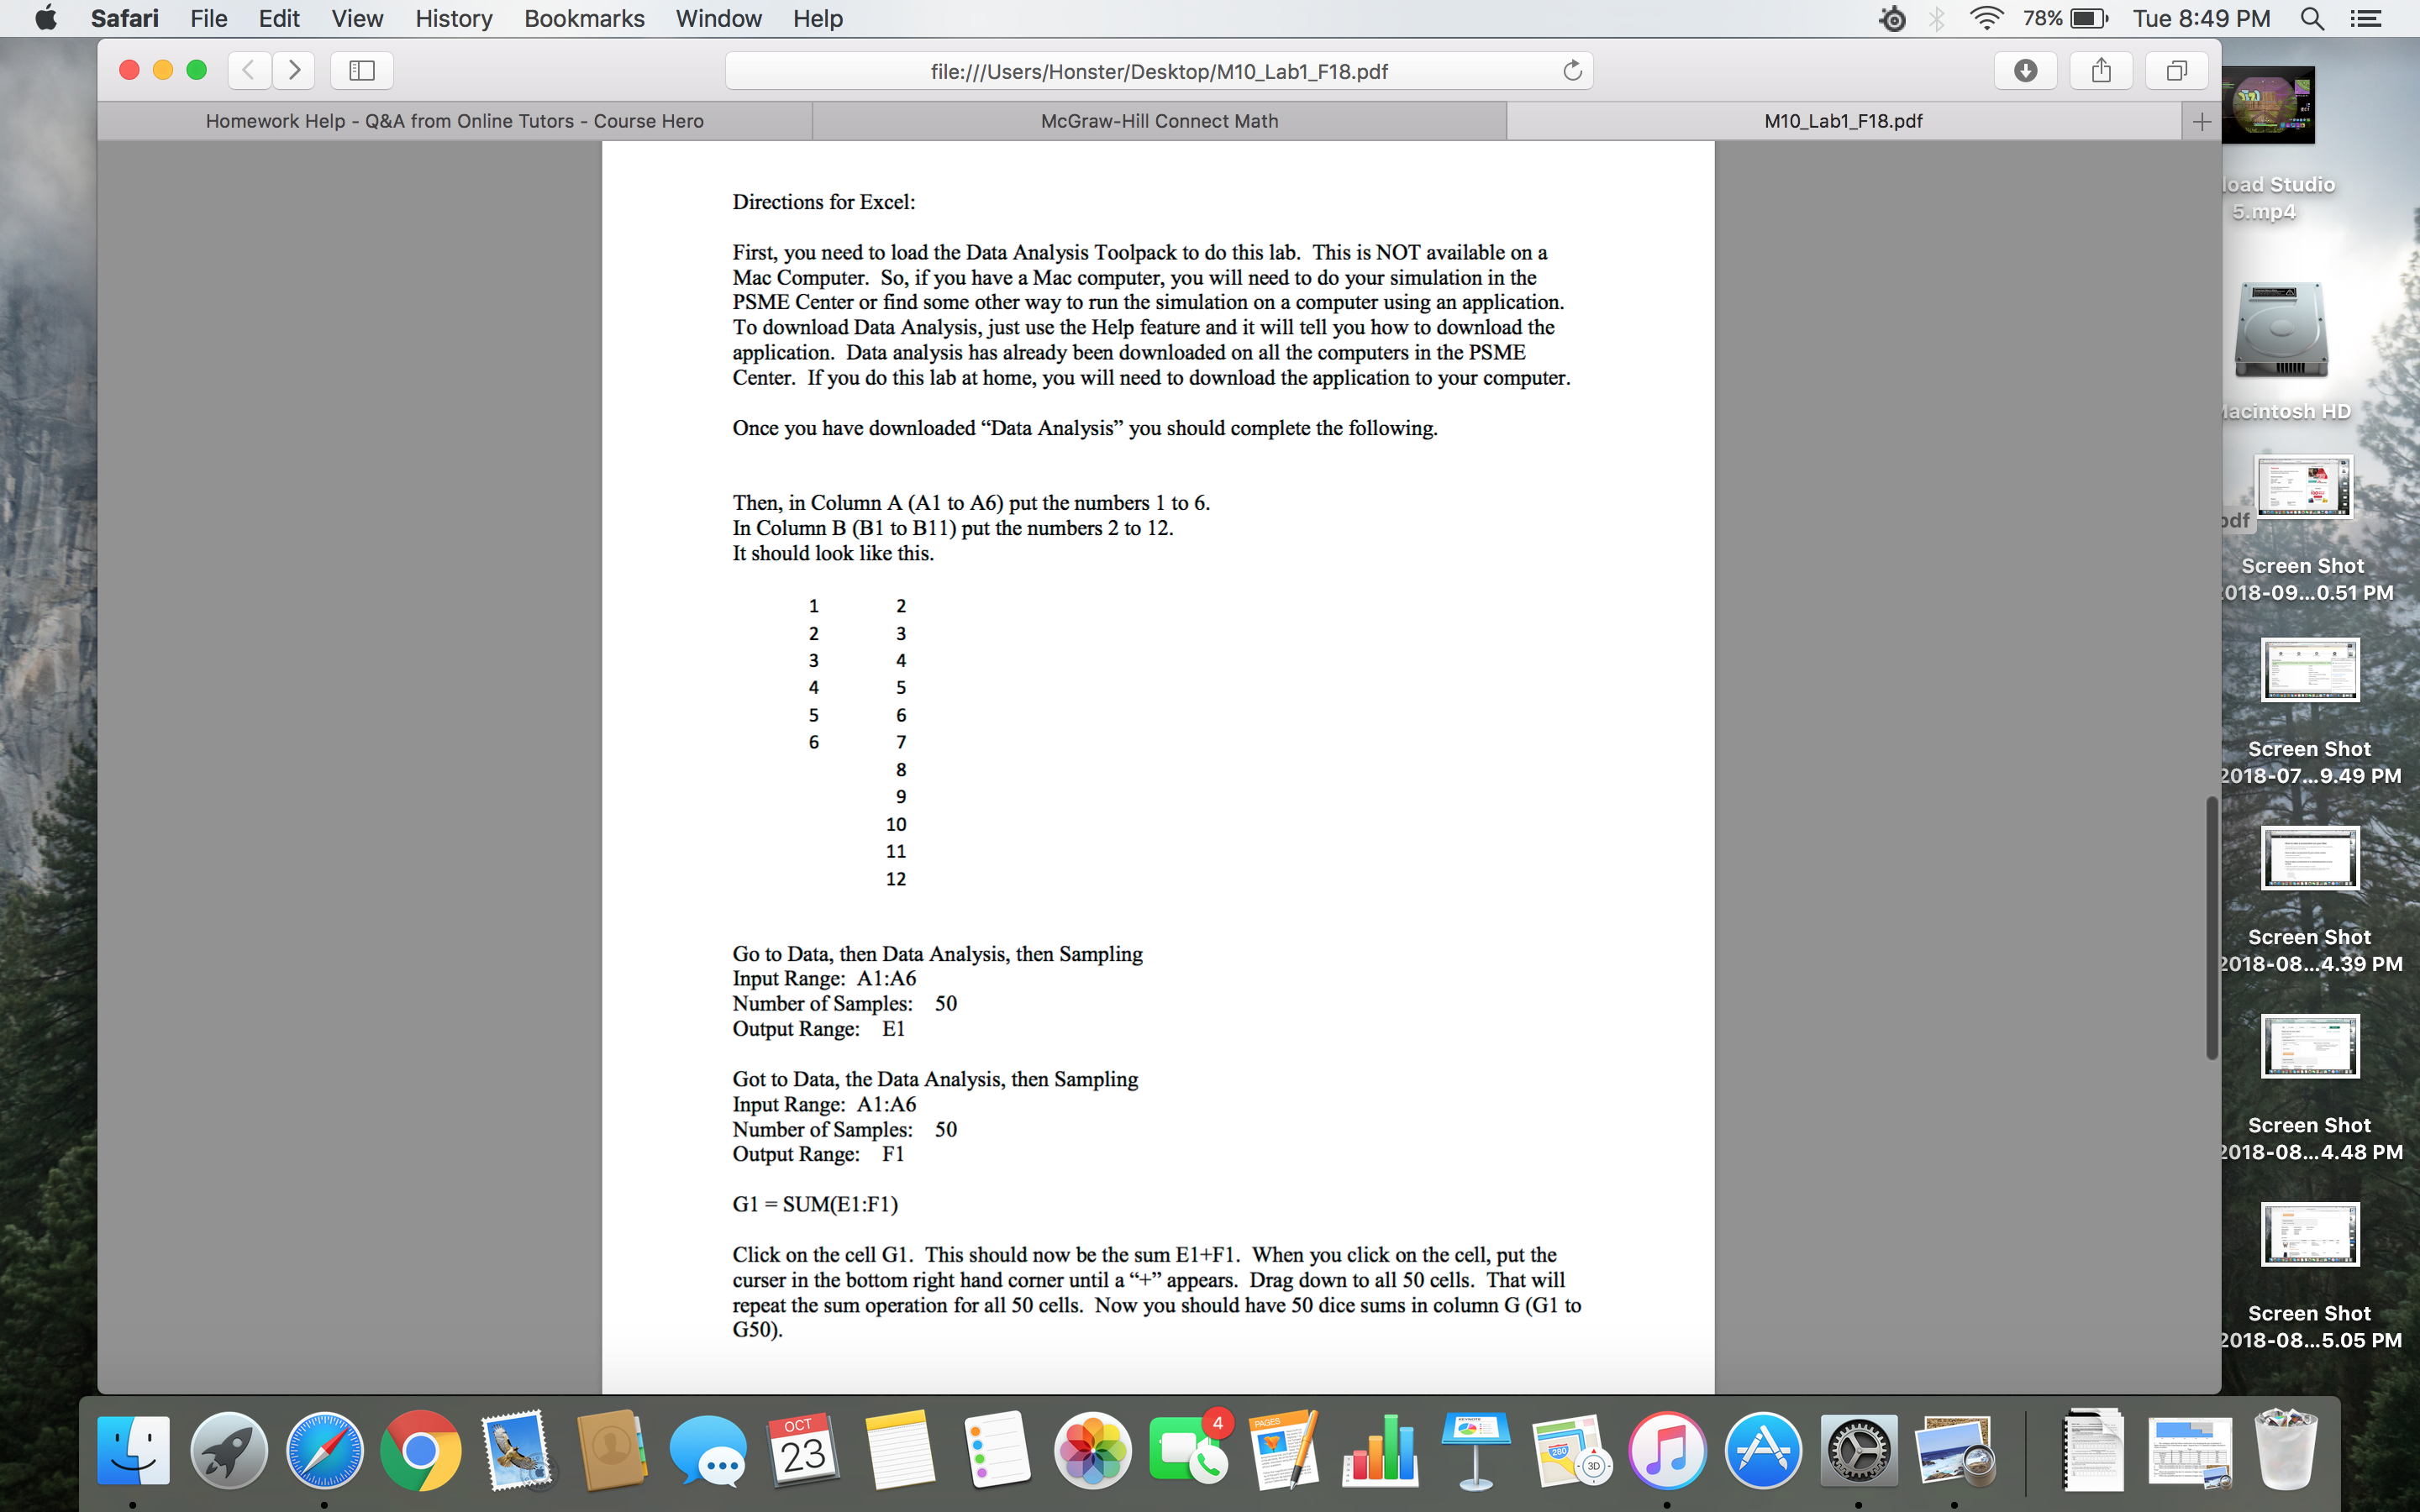

6 Safari File Edit View History Bookmarks Window Help - Tue8:48 PM Q Hog; file:l/lUsers/Honster/Desktop/M'l 0_Lab1_F18.pdf 1. Letx = the sum nfa pairoffairdice being rolled. Construct a table that displays the probability diminution at X Give your answers as decimals minded to three decimal places. Show your work, 2 3 4 5 5 1D 11 12 x P00 2. Use Excel to simulate rolling a pair of fair Then. aerate a table of the relative iremenciee. Show your work. x 2 3 4 5 6 7 8 ReL Freq. (50 rolls) lProbabilityRelave Frequencyl Probability percent error in using a simulation to estimate what shuuld happen dramatically. 3. For each sum (2 through 12), Find x 2 3 4 5 6 7 8 9 10 seam (50 rolls) 4. Find the average of the percent ermis. Show your work. Based on your percent error, do you think that your simulation ofthe 50 rolls did a goodjub ofmjmating what was supposed to haypentheoretically'l Explain 5. Use Excel to simulate rolling apair affair dice 1000 times and record the sum (See directions below) Thar, create a table of the relative equenciw. Show your work x 2 3 4 5 6 7 B 9 10 11 Rel. Freq. (1 000 rolls) M10J.ab'l_F18.pdf Screen Shot 318-09m0.51 PM Screen Shot '018-07m9.49 PM Screen Shot ,D'lS-U .39 PM Screen Shot 7018-08..,4.48 PM Screen Shut ,018-08...5.05 PM C Safari File Edit View History Bookmarks Window Help . , 4:? 78% - Tue8:49 PM Q 0 0 0 5 file:l/lUsers/Honster/Desktole'l0_Lab1_F18.pdf M10J.ab1_F18.pdf |ProbabilityRelave Frequency| Probability percent error in using a simulation to esu'nme who should happen iheoreticnlly. Show all work. 6. For each sum (2 through 12), Find '100 . This is the x 2 a a 9 10 l 11 12 %Emor (1000 rolls) Screen Shot 7. Find the average ofthe percent errors. Show your work. Basedonyour peroent mar, do you )18-09...0.51 pM think that your simulation ofthe 1000 ml]: did a modjob ofesmang what was supposed to happen theoretically? Explain. 8. Which simulation (50 rolls or 1000 mils) better corresponds to Ihe true probabilities? Compare your average pacent errors to makethis determination. Explain. 9. Should you have expected In seethe Mills that you did indeed see? Why should you have SWEET! Shot expemedsuchresults'! Explain. '018-07..l9.49 PM Screen Shot ,D'lS-U .39 PM Screen Shot .018-08..,4.48 PM Screen Shot ,018-08...5.05 PM C Safari File Edit View History Bookmarks Window Help . , 4:? 78% - Tue8:49 PM Q 0 0 0 5 fi|e:l/IUsers/Honster/Desktole'l0_Lab1_F18.pdf M10J.ab'l_F18.pdf Directions for Excel: First, you need to load the Data Analysis Toolpack to do this lab. This is NOT available on a Mac Computer. So, ifyou have aMac computer, you will nudto do your simulation inthe PSME C-ter or nd some other way to run the simulation on a computer using an application. To download Data Analysis, just use the Help feature and it will tell you how to download the application. Data analysis has already been downloaded on all the computers in the PSMIE Canton Ifyou do this lab at home, you will need to download the application to your computer. Once you have downloaded \"Data Analysis\" you should complete the following. Then,inCol|nnnA(Al toA6)putthemnnbeis 1 ms. InColumnB(BltnBll)putthenumhers2to 12. It shouldlook likethis. Screen Shot 318-09m0.51 PM Screen Shot '018-07m9.49 PM 10 ll 12 Screen Shot GotoDam, thenDataAnalysis, then Sampling ,n18-0 _39 PM Input Range: A1:A6 Number of Samples: 50 Output Range: E1 GottoDota, the Data Analysis, thenSampling InputRange: A1:A6 NumberofSamples: 50 Screen Shot OutputRange: F1 .018-08..,4.48 PM 61 =SUM(E1:F1) Click on the cell 61. This should now be the sum E1+FL When you click on the cell, put the cum in the bottom right hand corner min] a \"+\" appears. Drag down to all 50 cells. That will repeat the sum operation for all 50 cells. Now you should have 50 dice sums in column G (GI to 650). Screen Shot .018-08...5.05 PM 6 Safari File Edit 0 0 0 s; View History Bookmarks Window Help fi|e:///Users/Honster/Desktop/M10_Lab1_F18.pdf - Tue8:49 PM Q Go on Data, dim Data Analysis, then Hismgram. Input Range: 612650 Bin Range: 51:31 1 Oulput Range: 11 BesuremclickinthnboxthatsaysChanOutpul Thw,yausho|dgetsornethingthatlookslikcdus. InthissimlaondratImn,lnevergota snmof2,twice-.Igotasumo,sevenlimeslgotasumof4,sixn'n1eslgntasumof5,etc. Bin Frequency 10 11 12 More You have now completed the simulation for 50 dice sums. To do the simulation for 1000 dice sums, repeat the shove steps, but instead of 50 samples, do 1000 samples, When you turn in your lab with your write up, be sure to include both \"Bin tabla." There should be a \"bin table" {hr 50 dice sums and a \"bin table\" for 1000 dice sums. Do um mm in the pages and pages of numbers that back up the simulation. M10J.ab1_F18.pdf Screen Shot 318-09m0.51 PM Screen Shot '018-07m9.49 PM Screen Shot ,D'lS-U .39 PM Screen Shot 7018-08..,4.48 PM Screen Shut ,018-08...5.05 PM
Step by Step Solution
There are 3 Steps involved in it

Get step-by-step solutions from verified subject matter experts