

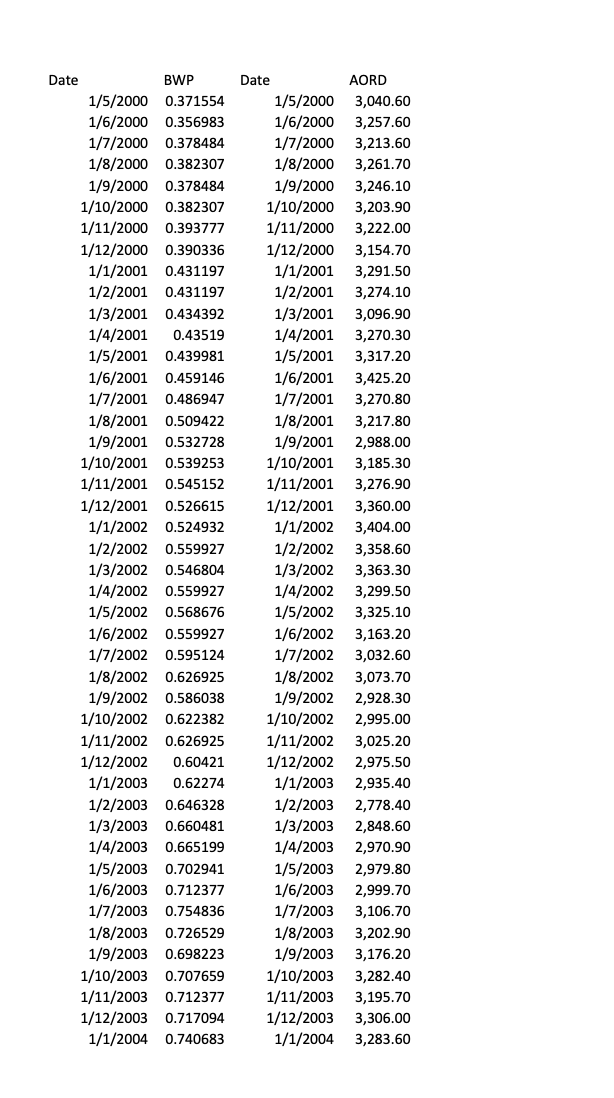
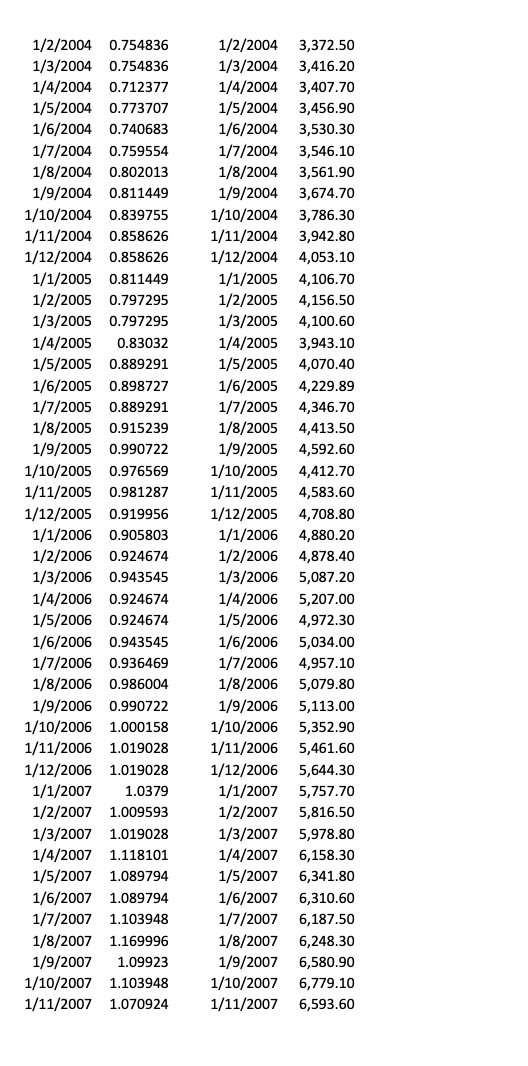
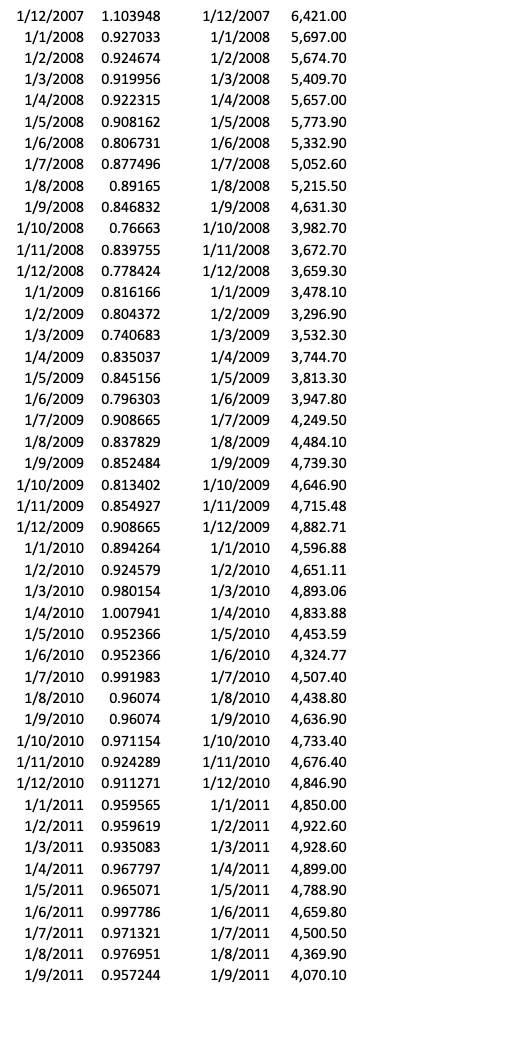
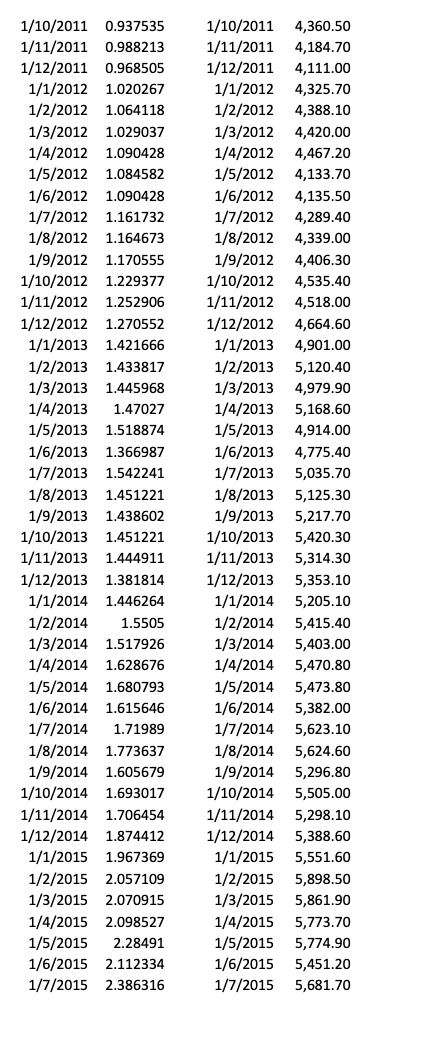
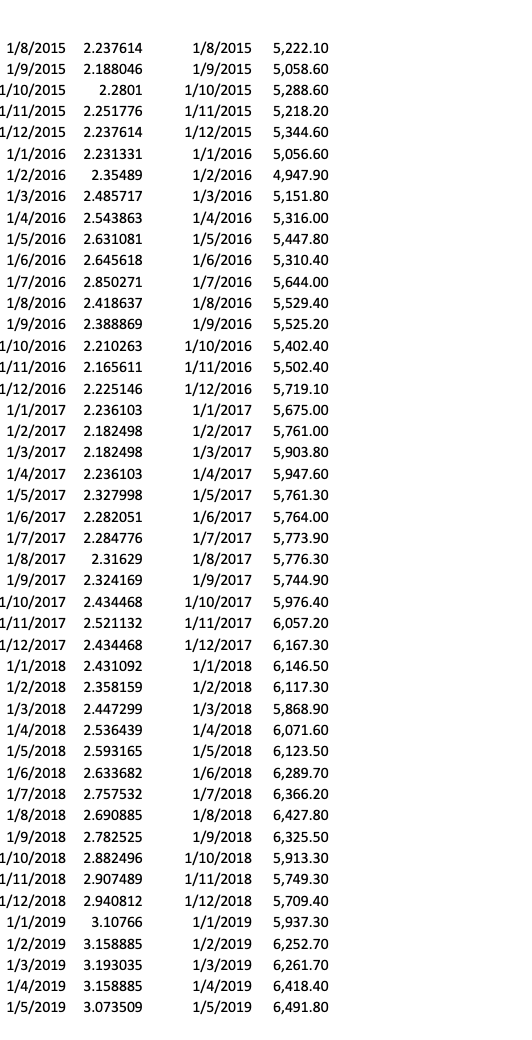
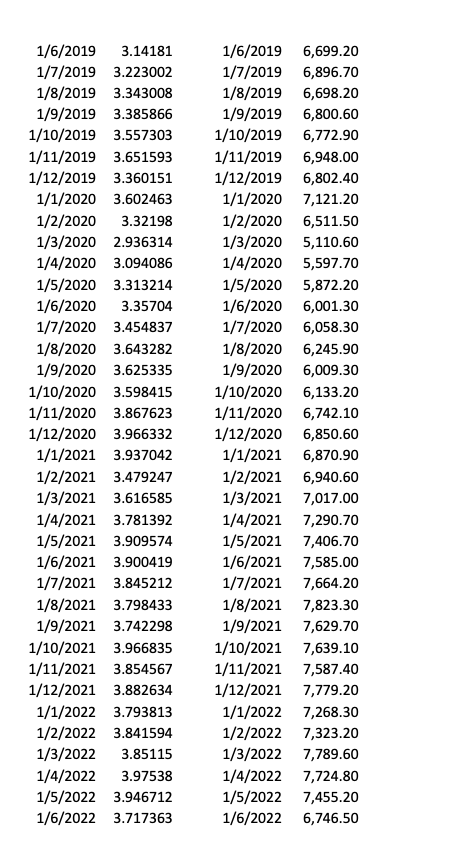
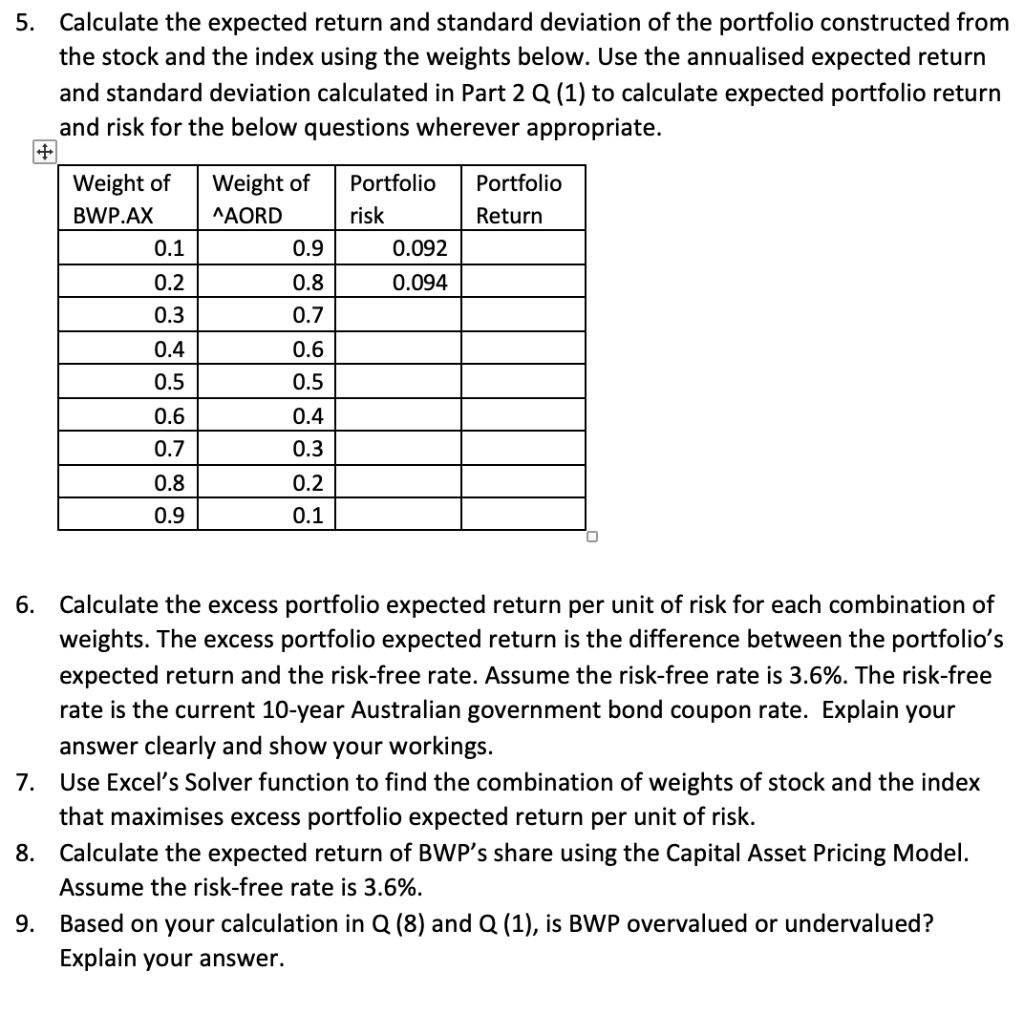
Question: Can you please do it in excel and please give me a formula as well ? Thanks 1/6/20191/7/20191/8/20191/9/20191/10/20191/11/20191/12/20191/1/20201/2/20201/3/20201/4/20201/5/20201/6/20201/7/20201/8/20201/9/20201/10/20201/11/20201/12/20201/1/20211/4/20221/2/20211/3/20221/3/20211/4/20211/5/20211/6/20211/7/20211/8/20211/9/20211/10/20211/11/20211/12/20211/1/20221/202213.851151/203.141813.2230023.3430083.3858663.5573033.6515933.3601513.6024633.321982.9363143.0940863.3132143.357043.4548373.6432823.6253353.5984153.8676233.9663323.9370423.975383.4792473.9467123.6165853.7813923.9095743.9004193.8452123.7984333.7422983.9668353.8545673.8826343.7938133.8415941/3/20221/6/20191/7/20191/8/20191/9/20191/10/20191/11/20191/12/20191/1/20201/2/20201/3/20201/4/20201/5/20201/6/20201/7/20201/8/20201/9/20201/10/20201/11/20201/12/20201/1/20211/4/20221/2/20211/5/20221/3/20211/4/20211/5/20211/6/20211/7/20211/8/20211/9/20211/10/20211/11/20211/12/20211/1/20221/2/20227,789.606,699.206,896.706,698.206,800.606,772.906,948.006,802.407,121.206,511.505,110.605,597.705,872.206,001.306,058.306,245.906,009.306,133.206,742.106,850.606,870.907,724.806,940.607,455.207,017.007,290.707,406.707,585.007,664.207,823.307,629.707,639.107,587.407,779.207,268.307,323.20 5. Calculate the expected return and standard
Can you please do it in excel and please give me a formula as well ?
Thanks
1/6/20191/7/20191/8/20191/9/20191/10/20191/11/20191/12/20191/1/20201/2/20201/3/20201/4/20201/5/20201/6/20201/7/20201/8/20201/9/20201/10/20201/11/20201/12/20201/1/20211/4/20221/2/20211/3/20221/3/20211/4/20211/5/20211/6/20211/7/20211/8/20211/9/20211/10/20211/11/20211/12/20211/1/20221/202213.851151/203.141813.2230023.3430083.3858663.5573033.6515933.3601513.6024633.321982.9363143.0940863.3132143.357043.4548373.6432823.6253353.5984153.8676233.9663323.9370423.975383.4792473.9467123.6165853.7813923.9095743.9004193.8452123.7984333.7422983.9668353.8545673.8826343.7938133.8415941/3/20221/6/20191/7/20191/8/20191/9/20191/10/20191/11/20191/12/20191/1/20201/2/20201/3/20201/4/20201/5/20201/6/20201/7/20201/8/20201/9/20201/10/20201/11/20201/12/20201/1/20211/4/20221/2/20211/5/20221/3/20211/4/20211/5/20211/6/20211/7/20211/8/20211/9/20211/10/20211/11/20211/12/20211/1/20221/2/20227,789.606,699.206,896.706,698.206,800.606,772.906,948.006,802.407,121.206,511.505,110.605,597.705,872.206,001.306,058.306,245.906,009.306,133.206,742.106,850.606,870.907,724.806,940.607,455.207,017.007,290.707,406.707,585.007,664.207,823.307,629.707,639.107,587.407,779.207,268.307,323.20 5. Calculate the expected return and standard deviation of the portfolio constructed from the stock and the index using the weights below. Use the annualised expected return and standard deviation calculated in Part 2Q (1) to calculate expected portfolio return and risk for the below questions wherever appropriate. 6. Calculate the excess portfolio expected return per unit of risk for each combination of weights. The excess portfolio expected return is the difference between the portfolio's expected return and the risk-free rate. Assume the risk-free rate is 3.6%. The risk-free rate is the current 10-year Australian government bond coupon rate. Explain your answer clearly and show your workings. 7. Use Excel's Solver function to find the combination of weights of stock and the index that maximises excess portfolio expected return per unit of risk. 8. Calculate the expected return of BWP's share using the Capital Asset Pricing Model. Assume the risk-free rate is 3.6%. 9. Based on your calculation in Q (8) and Q (1), is BWP overvalued or undervalued? Explain your answer. 1/6/20191/7/20191/8/20191/9/20191/10/20191/11/20191/12/20191/1/20201/2/20201/3/20201/4/20201/5/20201/6/20201/7/20201/8/20201/9/20201/10/20201/11/20201/12/20201/1/20211/4/20221/2/20211/3/20221/3/20211/4/20211/5/20211/6/20211/7/20211/8/20211/9/20211/10/20211/11/20211/12/20211/1/20221/202213.851151/203.141813.2230023.3430083.3858663.5573033.6515933.3601513.6024633.321982.9363143.0940863.3132143.357043.4548373.6432823.6253353.5984153.8676233.9663323.9370423.975383.4792473.9467123.6165853.7813923.9095743.9004193.8452123.7984333.7422983.9668353.8545673.8826343.7938133.8415941/3/20221/6/20191/7/20191/8/20191/9/20191/10/20191/11/20191/12/20191/1/20201/2/20201/3/20201/4/20201/5/20201/6/20201/7/20201/8/20201/9/20201/10/20201/11/20201/12/20201/1/20211/4/20221/2/20211/5/20221/3/20211/4/20211/5/20211/6/20211/7/20211/8/20211/9/20211/10/20211/11/20211/12/20211/1/20221/2/20227,789.606,699.206,896.706,698.206,800.606,772.906,948.006,802.407,121.206,511.505,110.605,597.705,872.206,001.306,058.306,245.906,009.306,133.206,742.106,850.606,870.907,724.806,940.607,455.207,017.007,290.707,406.707,585.007,664.207,823.307,629.707,639.107,587.407,779.207,268.307,323.20 5. Calculate the expected return and standard deviation of the portfolio constructed from the stock and the index using the weights below. Use the annualised expected return and standard deviation calculated in Part 2Q (1) to calculate expected portfolio return and risk for the below questions wherever appropriate. 6. Calculate the excess portfolio expected return per unit of risk for each combination of weights. The excess portfolio expected return is the difference between the portfolio's expected return and the risk-free rate. Assume the risk-free rate is 3.6%. The risk-free rate is the current 10-year Australian government bond coupon rate. Explain your answer clearly and show your workings. 7. Use Excel's Solver function to find the combination of weights of stock and the index that maximises excess portfolio expected return per unit of risk. 8. Calculate the expected return of BWP's share using the Capital Asset Pricing Model. Assume the risk-free rate is 3.6%. 9. Based on your calculation in Q (8) and Q (1), is BWP overvalued or undervalued? Explain your
Step by Step Solution
There are 3 Steps involved in it

Get step-by-step solutions from verified subject matter experts