

Question: Can you please explain also how you calculate the %. Thank you! Compare Income Statements and Balance Sheets of Competitors a. Following are selected income
 Can you please explain also how you calculate the %. Thank you!
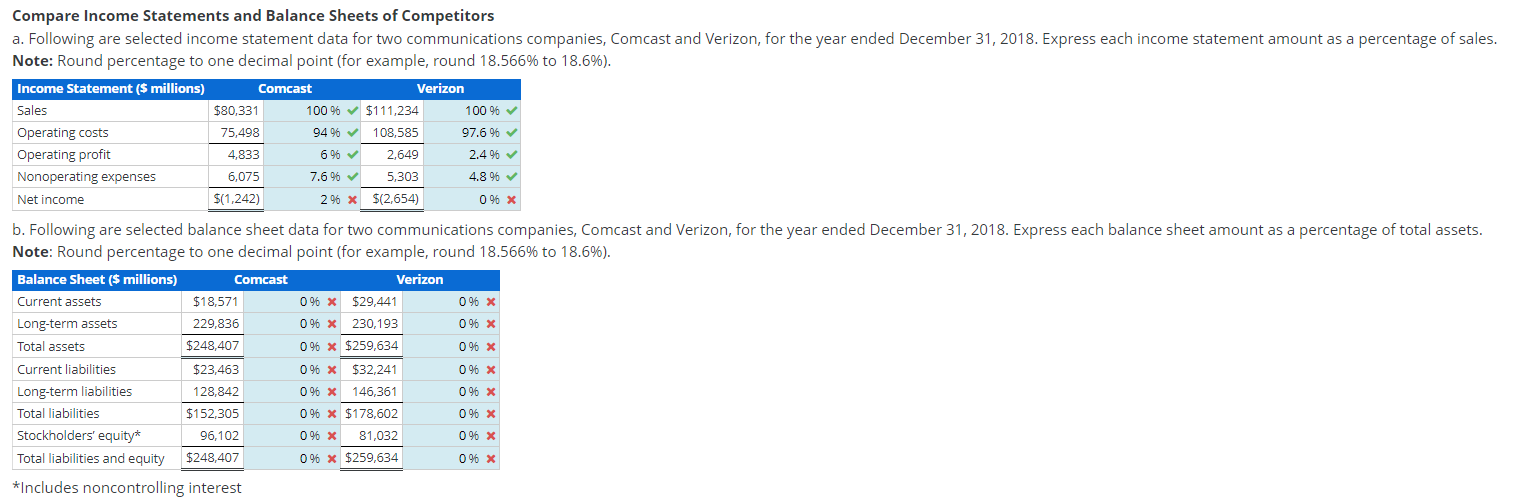
Compare Income Statements and Balance Sheets of Competitors a. Following are selected income statement data for two communications companies, Comcast and Verizon, for the year ended December 31, 2018. Express each income statement amount as a percentage of sales. Note: Round percentage to one decimal point (for example, round 18.566% to 18.6%). Income Statement ($ millions) Comcast Verizon Sales $80,331 Operating costs Operating profit 100% $111,234 94% 108,585 6% 2,649 7.6% 5,303 100% 97.6% 2.4% 75,498 4,833 6,075 $(1,242) Nonoperating expenses 4.8% Net income 2% * $(2,654) 0% * b. Following are selected balance sheet data for two communications companies, Comcast and Verizon, for the year ended December 31, 2018. Express each balance sheet amount as a percentage of total assets. Note: Round percentage to one decimal point (for example, round 18.566% to 18.6%). Balance Sheet ($ millions) Comcast Verizon $18,571 0% * Current assets Long-term assets 0% * $29,441 0% 230,193 0% * $259,634 0% * 229,836 $248,407 $23,463 Total assets 0% * 0% * $32,241 0% * Current liabilities Long-term liabilities 128,842 0% * 146,361 0% * Total liabilities $152,305 0% * $178,602 0% * Stockholders' equity* 96,102 0% * 81,032 0% * Total liabilities and equity $248,407 0% * $259,634 0% * *Includes noncontrolling interest
Step by Step Solution
There are 3 Steps involved in it

Get step-by-step solutions from verified subject matter experts