

Question: Can you please explain, for both individual tests and comparing the two tests, the characteristic (prevalence, positive test rate, and chance agreement) estimated values and
Can you please explain, for both individual tests and comparing the two tests, the characteristic (prevalence, positive test rate, and chance agreement) estimated values and how it relates to their respective benchmarks (predictive value, sensitivity/specificity, and accuracy)?
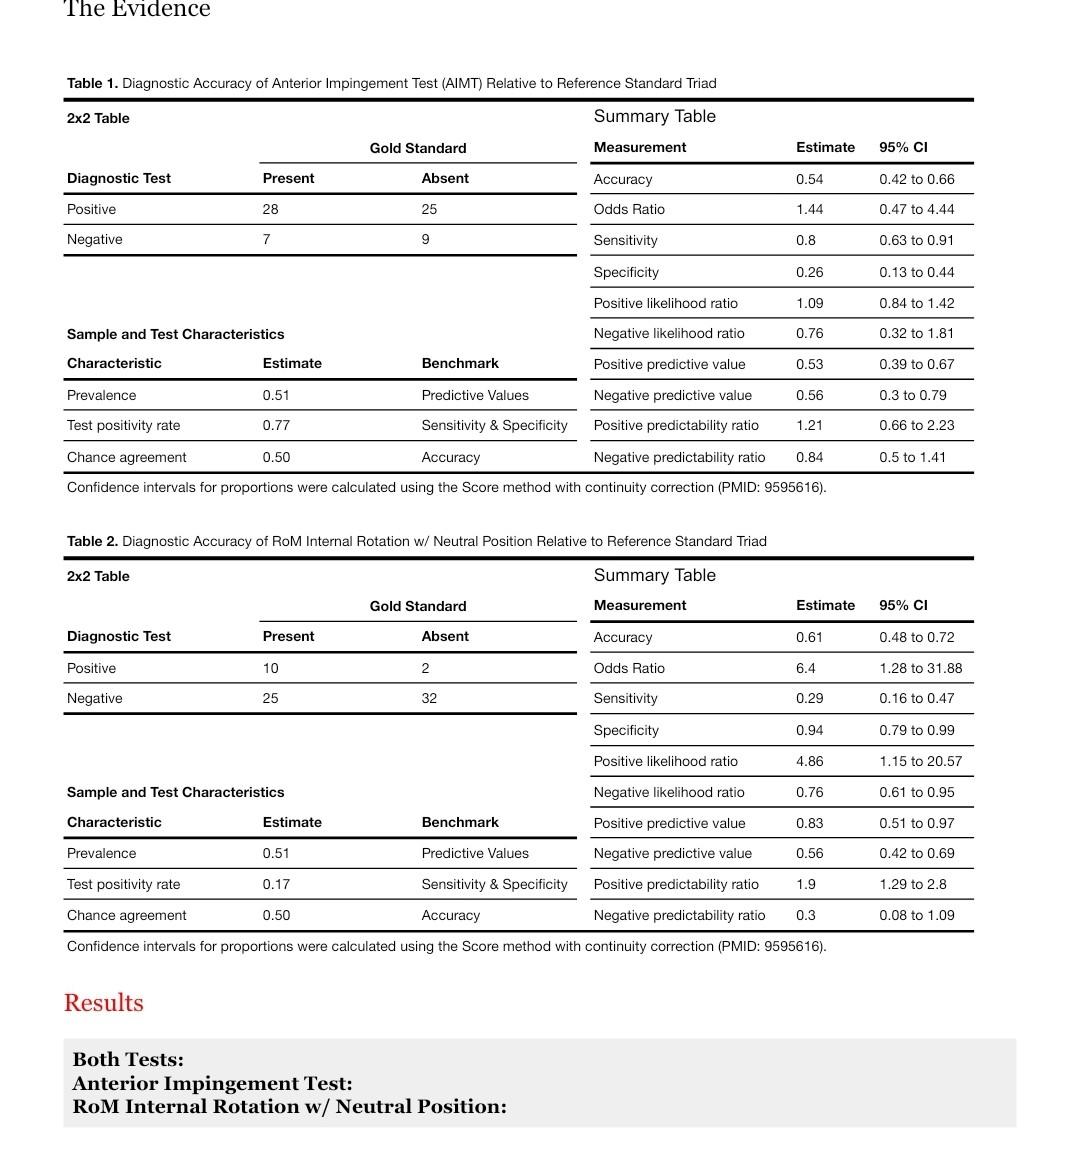
The Evidence Table 1. Diagnostic Accuracy of Anterior Impingement Test (AIMT) Relative to Reference Standard Triad 2x2 Table Summary Table Gold Standard Measurement Estimate 95% CI Diagnostic Test Present Absent Accuracy 0.54 0.42 to 0.66 Positive 28 25 Odds Ratio 1.44 0.47 to 4.44 Negative 7 9 Sensitivity 0.8 0.63 to 0.91 Specificity 0.26 0.13 to 0.44 Positive likelihood ratio 1.09 0.84 to 1.42 Sample and Test Characteristics Negative likelihood ratio 0.76 0.32 to 1.81 Characteristic Estimate Benchmark Positive predictive value 0.53 0.39 to 0.67 Prevalence 0.51 Predictive Values Negative predictive value 0.56 0.3 to 0.79 Test positivity rate 0.77 Sensitivity & Specificity Positive predictability ratio 1.21 0.66 to 2.23 Chance agreement 0.50 Accuracy Negative predictability ratio 0.84 0.5 to 1.41 Confidence intervals for proportions were calculated using the Score method with continuity correction (PMID: 9595616). Table 2. Diagnostic Accuracy of ROM Internal Rotation w/ Neutral Position Relative to Reference Standard Triad 2x2 Table Summary Table Gold Standard Measurement Estimate 95% CI Diagnostic Test Present Absent Accuracy 0.61 0.48 to 0.72 Positive 10 2 2 Odds Ratio 6.4 1.28 to 31.88 Negative 25 32 Sensitivity 0.29 0.16 to 0.47 Specificity 0.94 0.79 to 0.99 Positive likelihood ratio 4.86 1.15 to 20.57 Sample and Test Characteristics Negative likelihood ratio 0.76 0.61 to 0.95 Characteristic Estimate Benchmark Positive predictive value 0.83 0.51 to 0.97 Prevalence 0.51 Predictive Values Negative predictive value 0.56 0.42 to 0.69 1.29 to 2.8 Test positivity rate 0.17 Sensitivity & Specificity Positive predictability ratio 1.9 Chance agreement 0.50 Accuracy Negative predictability ratio 0.3 Confidence intervals for proportions were calculated using the Score method with continuity correction (PMID: 9595616). 0.08 to 1.09 Results Both Tests: Anterior Impingement Test: ROM Internal Rotation w/ Neutral Position: The Evidence Table 1. Diagnostic Accuracy of Anterior Impingement Test (AIMT) Relative to Reference Standard Triad 2x2 Table Summary Table Gold Standard Measurement Estimate 95% CI Diagnostic Test Present Absent Accuracy 0.54 0.42 to 0.66 Positive 28 25 Odds Ratio 1.44 0.47 to 4.44 Negative 7 9 Sensitivity 0.8 0.63 to 0.91 Specificity 0.26 0.13 to 0.44 Positive likelihood ratio 1.09 0.84 to 1.42 Sample and Test Characteristics Negative likelihood ratio 0.76 0.32 to 1.81 Characteristic Estimate Benchmark Positive predictive value 0.53 0.39 to 0.67 Prevalence 0.51 Predictive Values Negative predictive value 0.56 0.3 to 0.79 Test positivity rate 0.77 Sensitivity & Specificity Positive predictability ratio 1.21 0.66 to 2.23 Chance agreement 0.50 Accuracy Negative predictability ratio 0.84 0.5 to 1.41 Confidence intervals for proportions were calculated using the Score method with continuity correction (PMID: 9595616). Table 2. Diagnostic Accuracy of ROM Internal Rotation w/ Neutral Position Relative to Reference Standard Triad 2x2 Table Summary Table Gold Standard Measurement Estimate 95% CI Diagnostic Test Present Absent Accuracy 0.61 0.48 to 0.72 Positive 10 2 2 Odds Ratio 6.4 1.28 to 31.88 Negative 25 32 Sensitivity 0.29 0.16 to 0.47 Specificity 0.94 0.79 to 0.99 Positive likelihood ratio 4.86 1.15 to 20.57 Sample and Test Characteristics Negative likelihood ratio 0.76 0.61 to 0.95 Characteristic Estimate Benchmark Positive predictive value 0.83 0.51 to 0.97 Prevalence 0.51 Predictive Values Negative predictive value 0.56 0.42 to 0.69 1.29 to 2.8 Test positivity rate 0.17 Sensitivity & Specificity Positive predictability ratio 1.9 Chance agreement 0.50 Accuracy Negative predictability ratio 0.3 Confidence intervals for proportions were calculated using the Score method with continuity correction (PMID: 9595616). 0.08 to 1.09 Results Both Tests: Anterior Impingement Test: ROM Internal Rotation w/ Neutral Position
Step by Step Solution
There are 3 Steps involved in it

Get step-by-step solutions from verified subject matter experts