

Question: Can you please explain how you got what graph it is Assume that water is poured into a spherical bottle at a constant rate. Which
Can you please explain how you got what graph it is

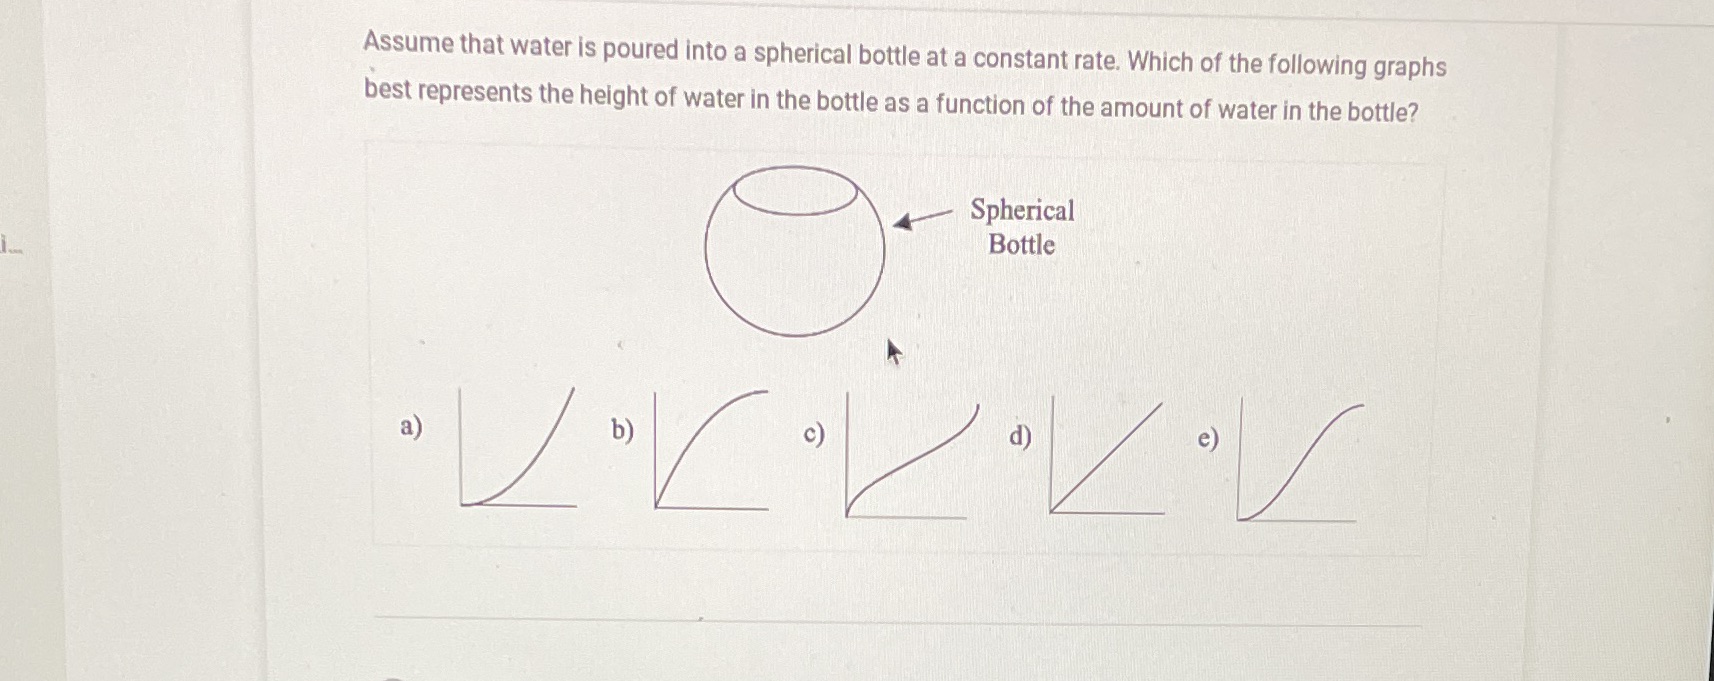
Assume that water is poured into a spherical bottle at a constant rate. Which of the following graphs best represents the height of water in the bottle as a function of the amount of water in the bottle? Spherical Bottle a)
Step by Step Solution
There are 3 Steps involved in it
1 Expert Approved Answer
Step: 1 Unlock

Question Has Been Solved by an Expert!
Get step-by-step solutions from verified subject matter experts
Step: 2 Unlock
Step: 3 Unlock