

Question: can you please explain this question Data Table Departure Delay (minutes) 104 Arrival Delay (minutes) 92 83 30 Departure Delay (minutes) Full data set I;
can you please explain this question
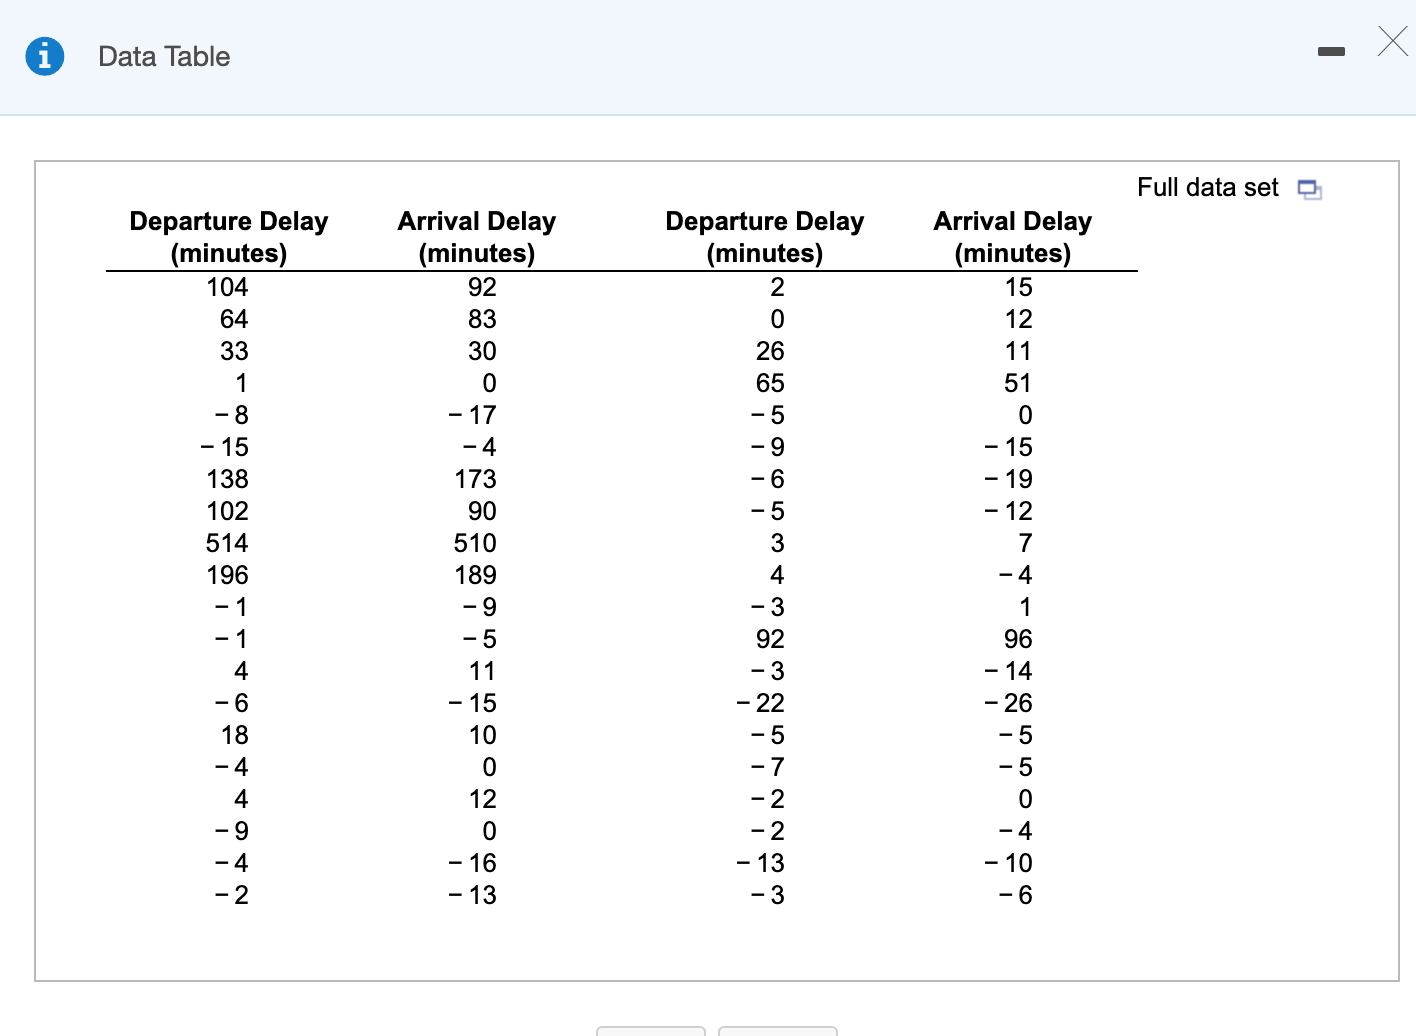
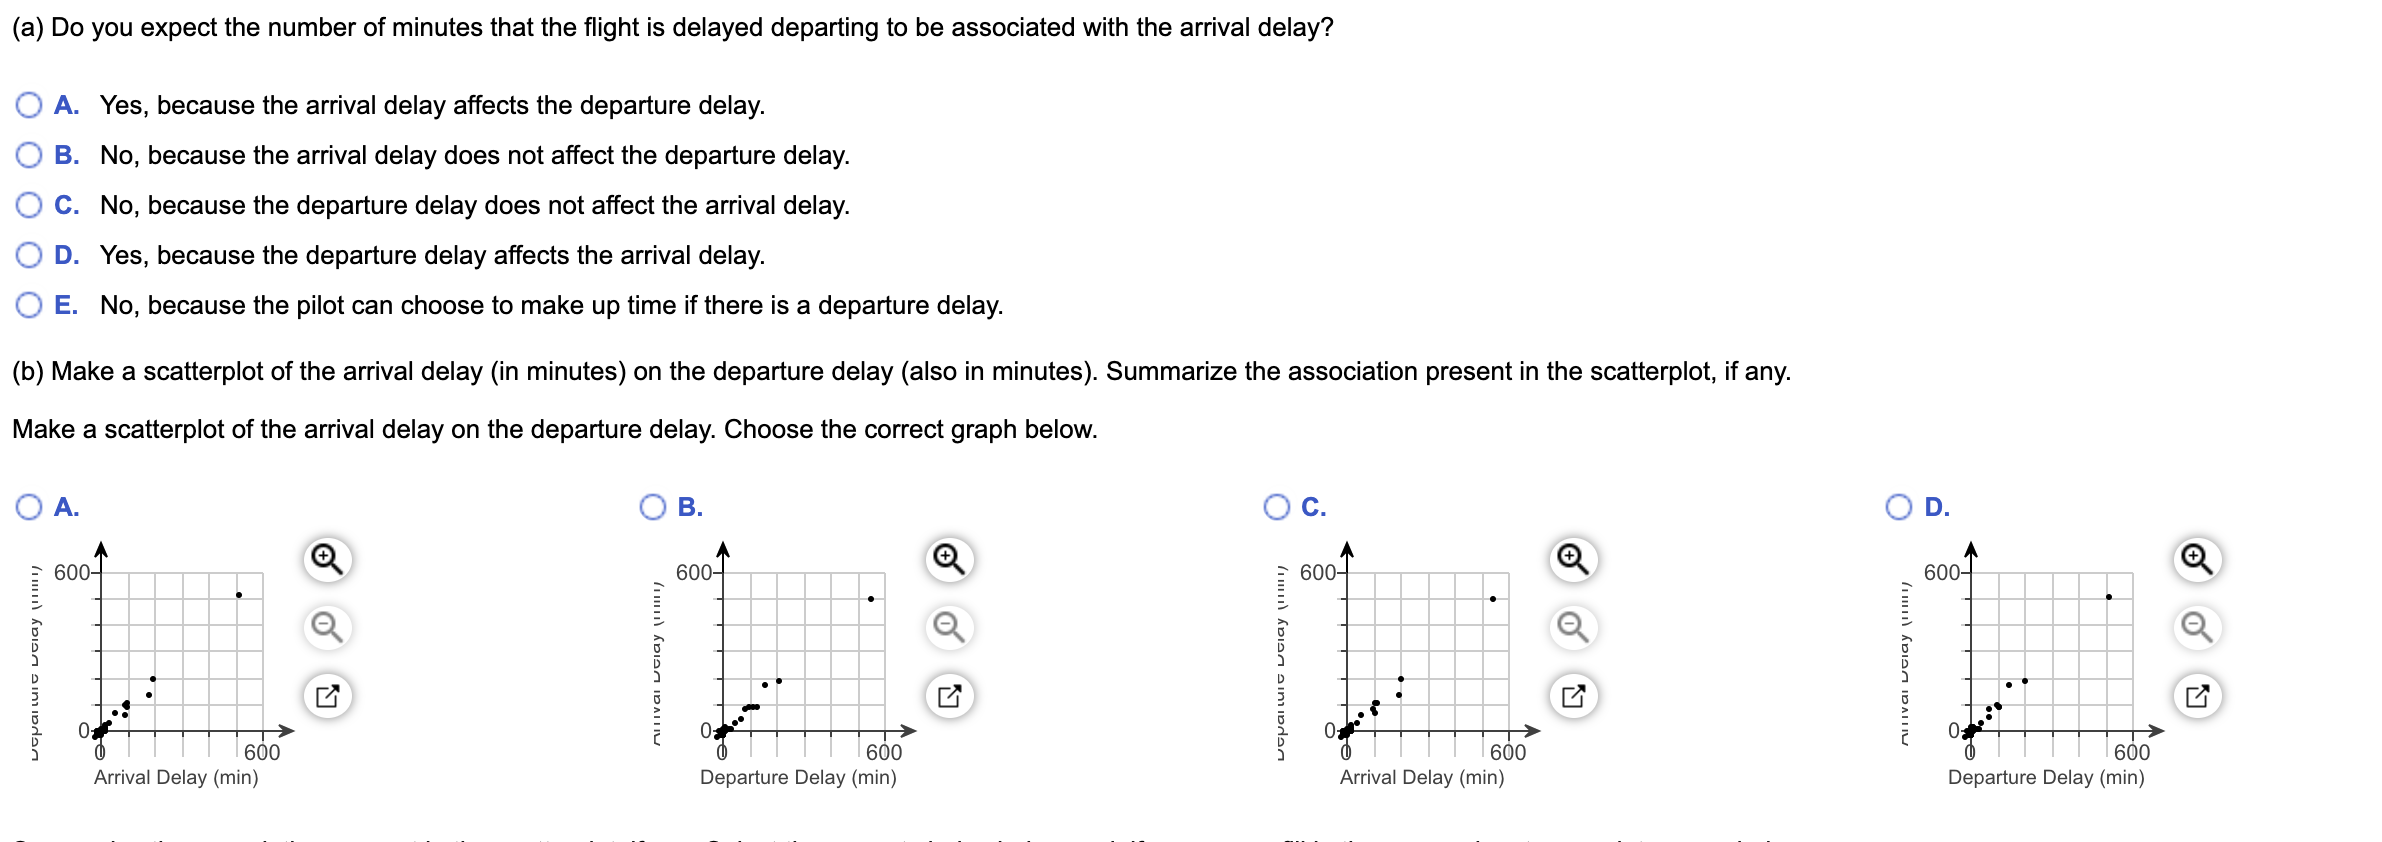

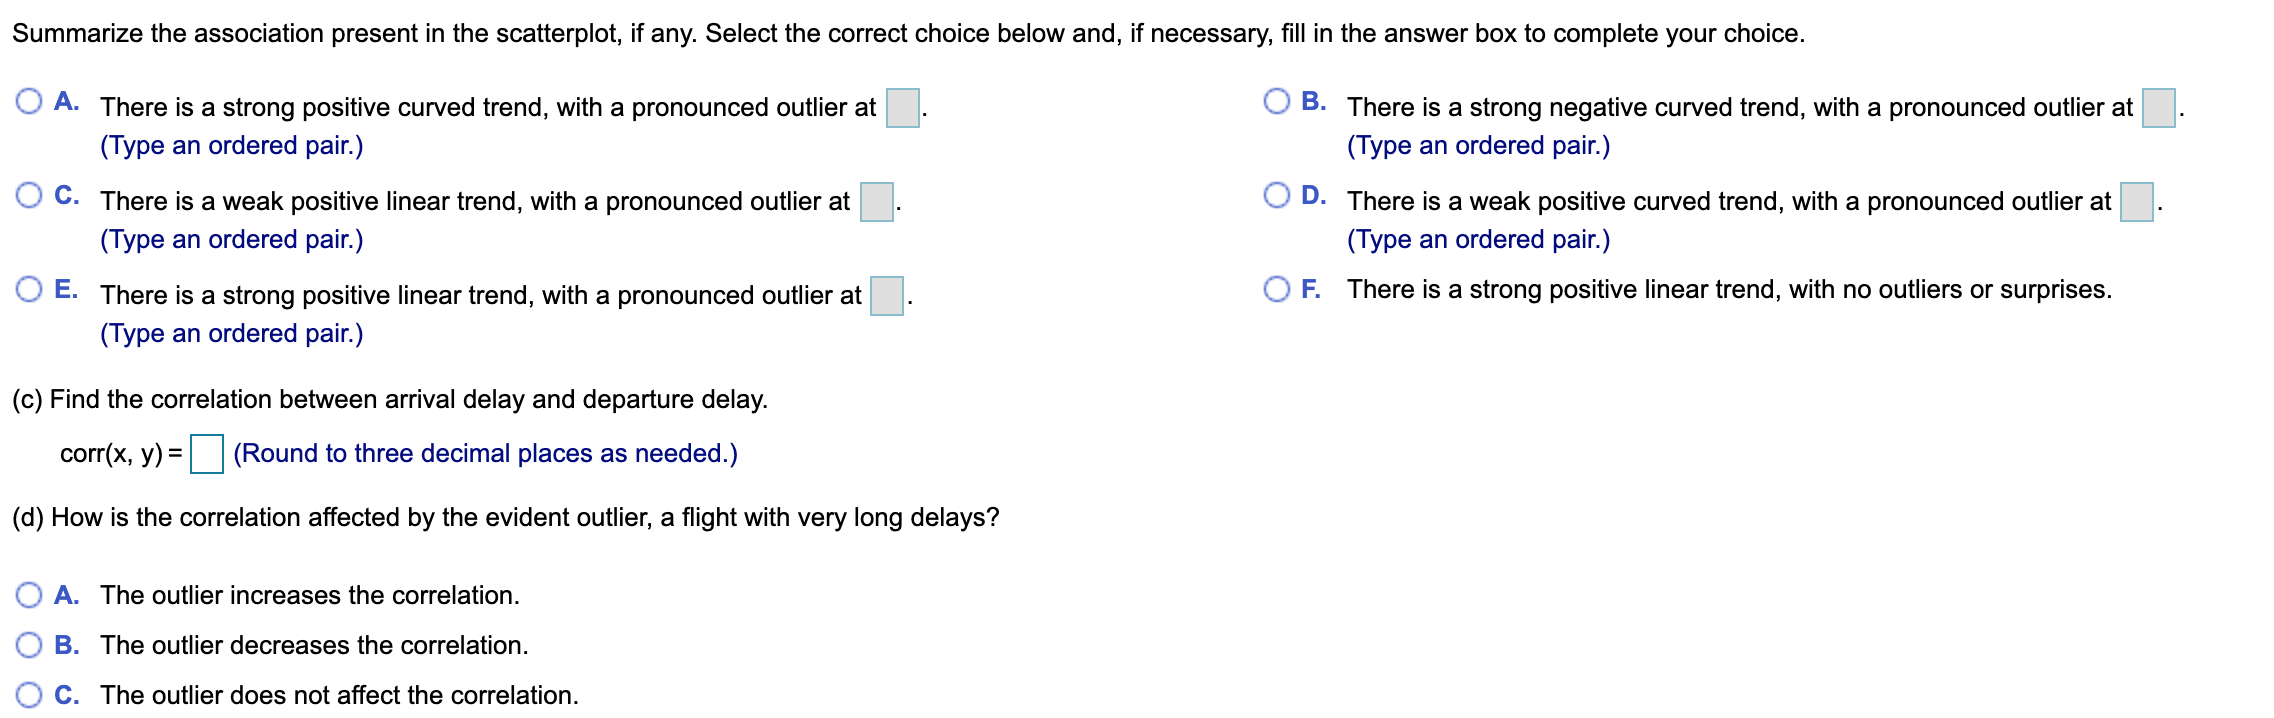
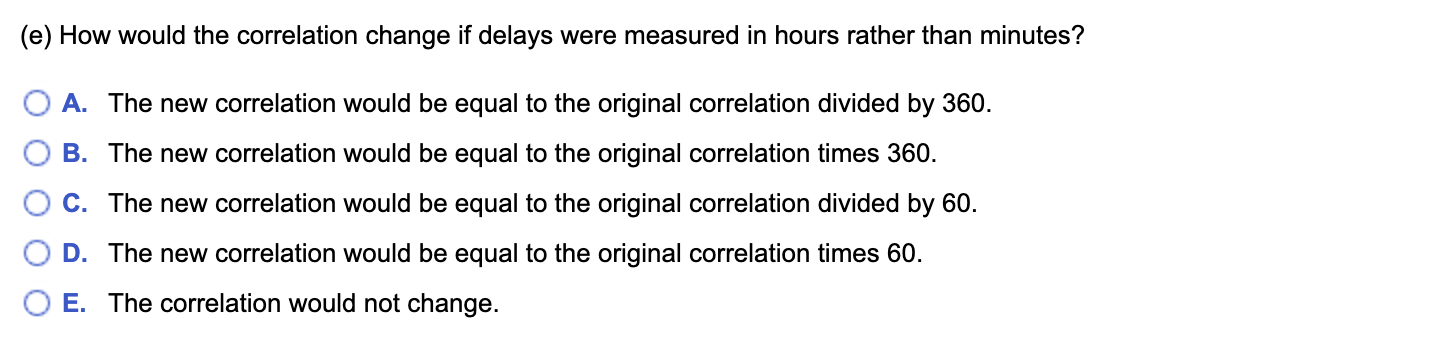
Data Table Departure Delay (minutes) 104 Arrival Delay (minutes) 92 83 30 Departure Delay (minutes) Full data set I; Arrival Delay (minutes) 15 12 11 51 0 15 19 12 7 - 4 1 96 14 (a) Do you expect the number of minutes that the ight is delayed departing to be associated with the arrival delay? 0 A. Yes, because the arrival delay affects the departure delay. 0 B. No, because the arrival delay does not affect the departure delay. 0 c. No, because the departure delay does not affect the an'ival delay. 0 D. Yes, because the departure delay affects the arrival delay. 0 E. No, because the pilot can choose to make up time if there is a departure delay. (b) Make a scatterplot of the arrival delay (in minutes) on the departure delay (also in minutes). Summarize the association present in the scatterplot, if any. Make a scatterplot of the arrival delay on the departure delay. Choose the correct graph below. OA- OB. O o O U 8 ? \"VP\"\"W' \"may \\II'III/ 3% iii 77 IS'. "'\"Vn' "'7'\"! \\""\"/ A ' ' A ' ' A . . \"mml 0' 6i l l 0' jil l l L, 0' e. e. W l 0. m +r Arrival Delay (min) Departure Delay (min) Arrival Delay (min) Departure Delay (min) '4:an u": ualay \\. m. ., If the airline flight that you are on is 20 minutes late departing, can you expect the pilot to make these minutes up by, say, flying faster than usual? The data in the accompanying table summarize the status of a sample of 40 flights. Complete parts a through e.Summarize the association present in the scatterplot, if any. Select the correct choice below and, if necessary, ll in the answer box to complete your choice. O A- There is a strong positive curved trend, with a pronounced outlier at . O 3- There is a strong negative curved trend, with a pronounced outlier at (Type an ordered pair.) (Type an ordered pair.) 0 C. There is a weak positive linear trend, with a pronounced outlier at . O D- There is a weak positive curved trend, with a pronounced outlier at (Type an ordered pair.) (Type an ordered pair.) 0 5- There is a strong positive linear trend, with a pronounced outlier at . O F- There is a strong positive linear trend, With "0 outliers 0" surprises. (Type an ordered pair.) (c) Find the correlation between arrival delay and departure delay. corr(x, y) = D (Round to three decimal places as needed.) (d) How is the correlation affected by the evident outlier, a ight with very long delays? O A. The outlier increases the correlation. O B. The outlier decreases the correlation. O c. The outlier does not affect the correlation. (e) How would the correlation change if delays were measured in hours rather than minutes? 0 A. The new correlation would be equal to the original correlation divided by 360. O B. The new correlation would be equal to the original correlation times 360. O C. The new correlation would be equal to the original correlation divided by 60. O D. The new correlation would be equal to the original correlation times 60. O E. The correlation would not change
Step by Step Solution
There are 3 Steps involved in it

Get step-by-step solutions from verified subject matter experts