

Question: Can you please explain this to me step by step. I don't understand how you get the intervals and the answers in general. Consider the
Can you please explain this to me step by step. I don't understand how you get the intervals and the answers in general.
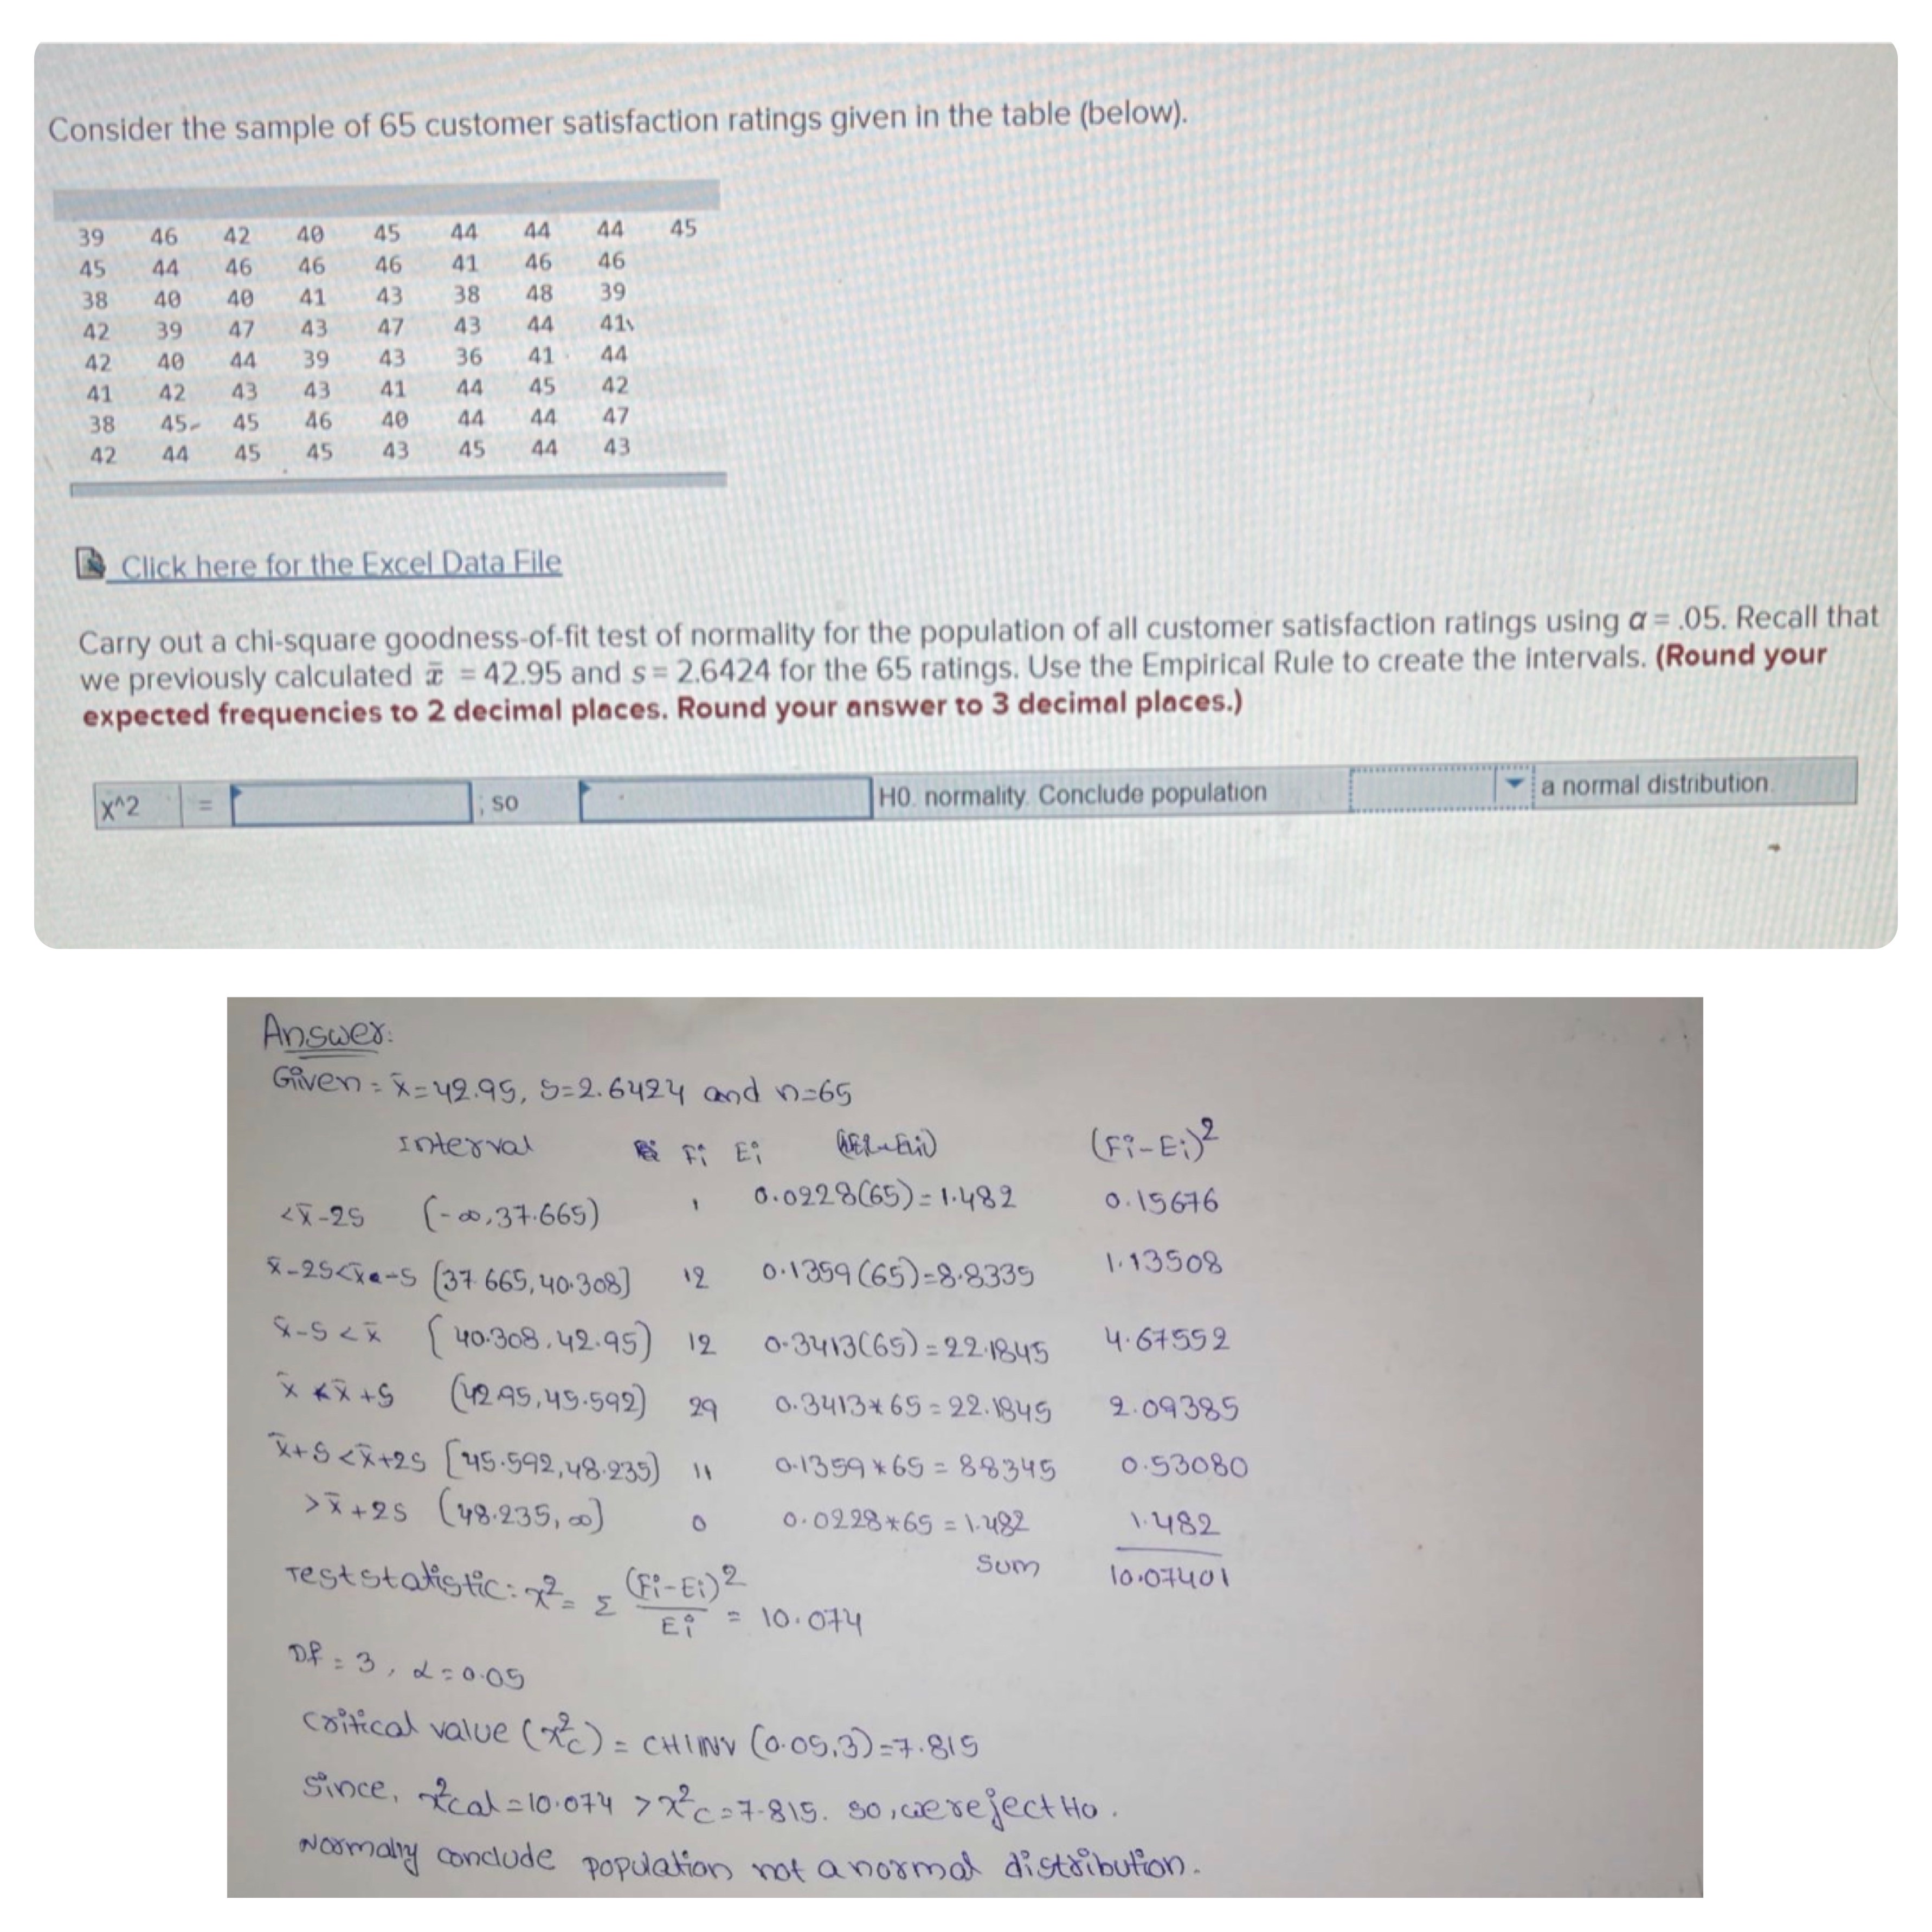
Consider the sample of 65 customer satisfaction ratings given in the table (below). 44 44 44 45 39 46 42 40 45 46 46 45 44 46 46 46 41 48 39 38 40 40 41 43 38 43 47 43 41\\ 42 39 44 39 43 36 44 42 40 44 45 42 41 42 41 44 44 47 38 45- 45 46 40 45 43 44 43 42 Click here for the Excel Data File Carry out a chi-square goodness-of-fit test of normality for the population of all customer satisfaction ratings using a = .05. Recall that we previously calculated a = 42.95 and s = 2.6424 for the 65 ratings. Use the Empirical Rule to create the intervals. (Round your expected frequencies to 2 decimal places. Round your answer to 3 decimal places.) a normal distribution. X1 2 = : so HO. normality. Conclude population Answer : Given : x= 49.95, 5=2. 6424 and 1=65 Interval RX Fi E: GER-ELIO ( Fi - E: ) 2 0. 0928 ( 65 ) = 1.482 0 . 15676
Step by Step Solution
There are 3 Steps involved in it

Get step-by-step solutions from verified subject matter experts