

Question: Can you please help confirm if my code is correct and makes sense I am trying to predict the following (Violent~ year + state +
Can you please help confirm if my code is correct and makes sense
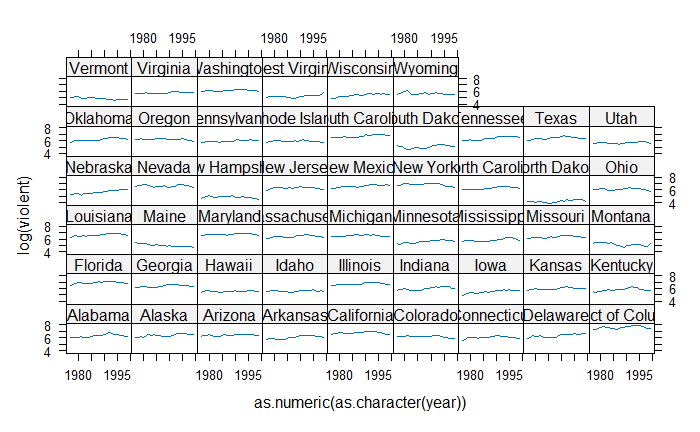
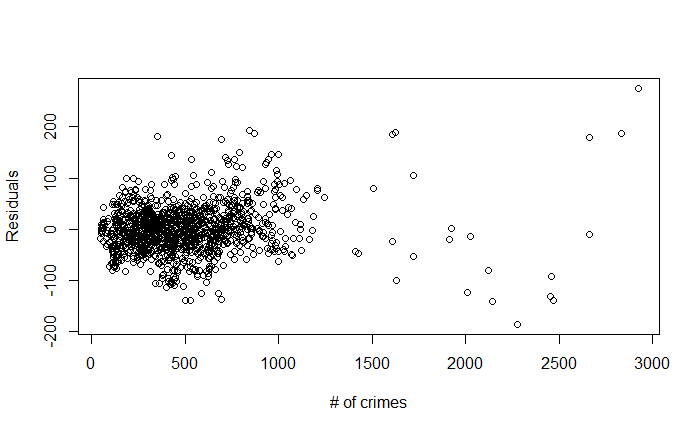
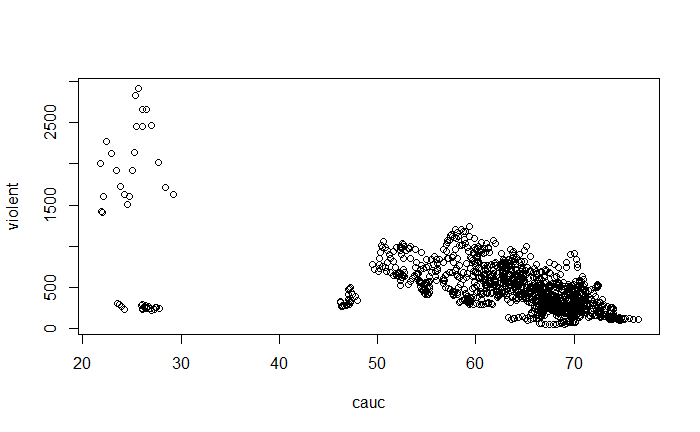
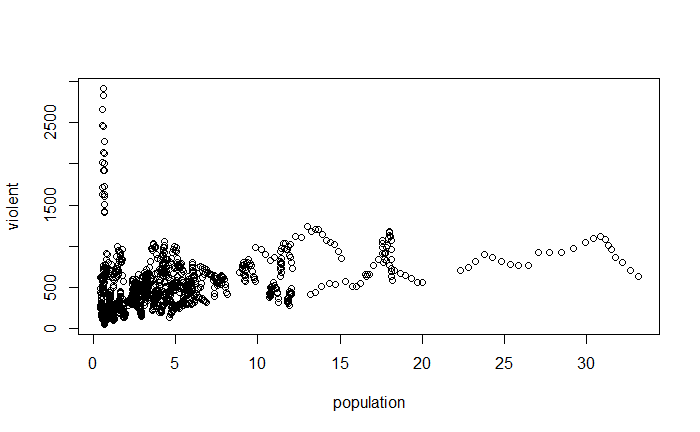
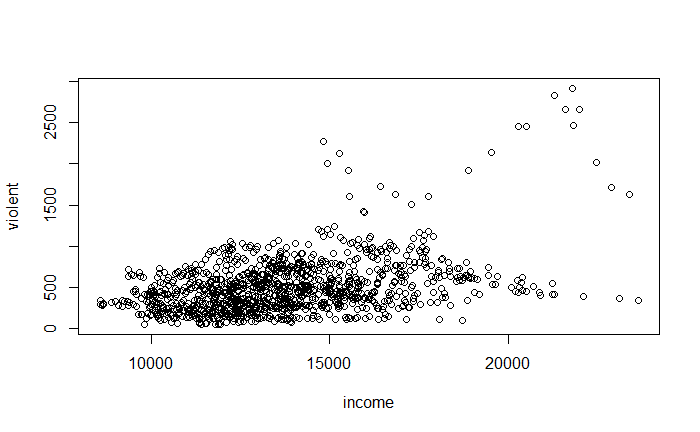
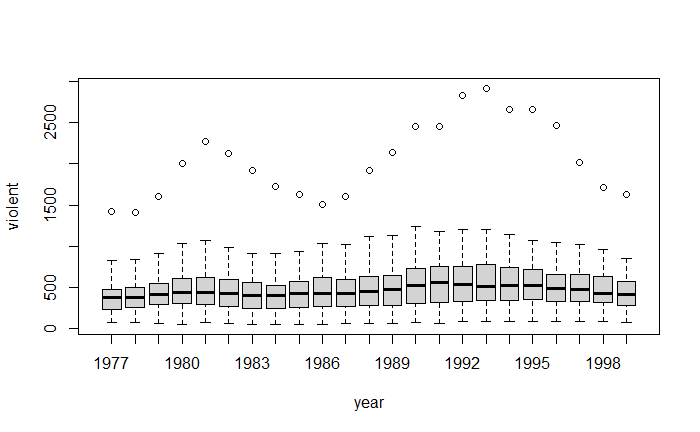
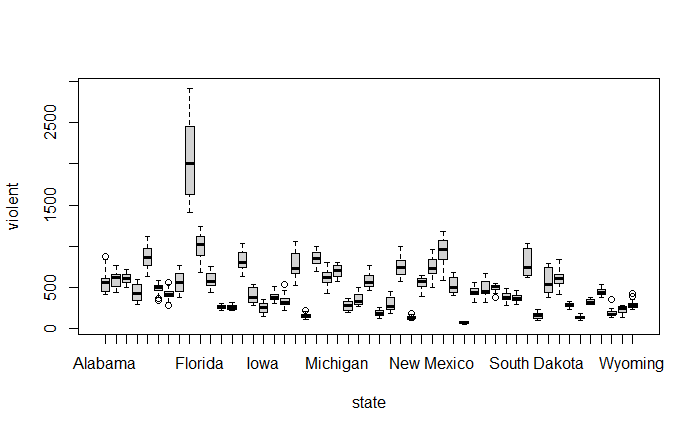
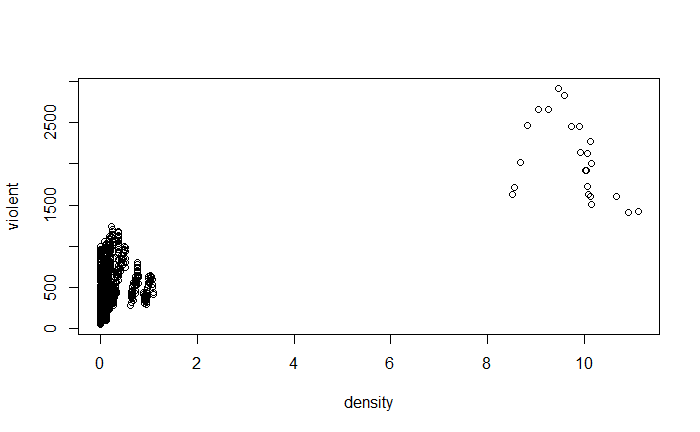
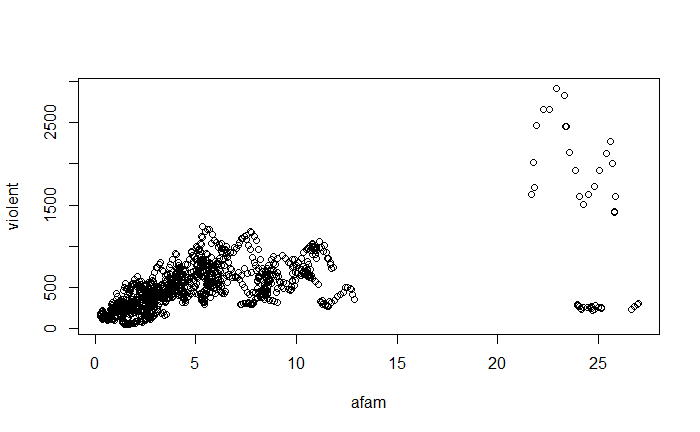
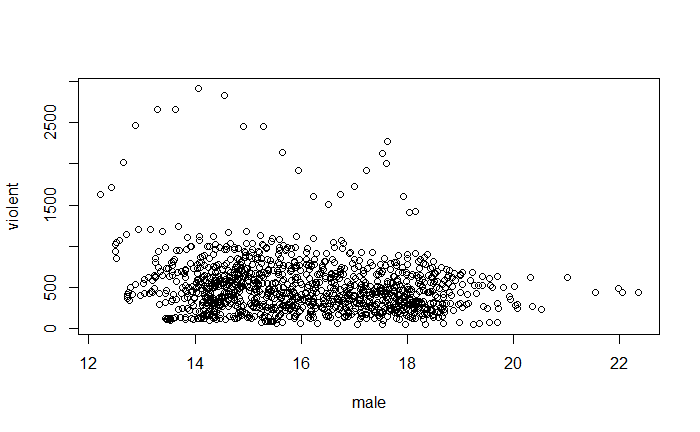
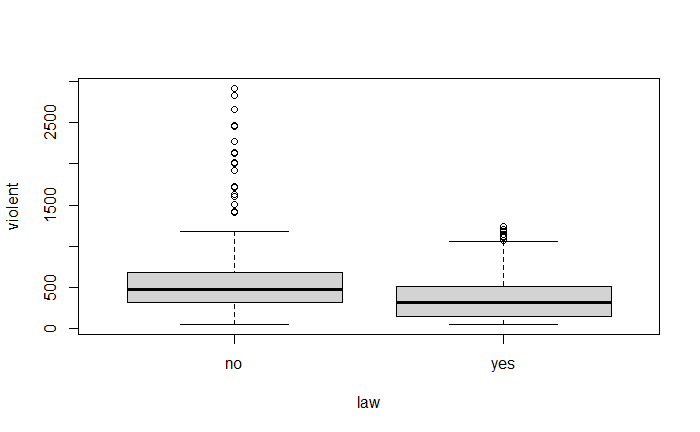
I am trying to predict the following (Violent~ year + state + law) to see if gun laws impact violent crime rates
*******P,Q,N, I am worried I am giving wrong variables ****** for hypothesis testing
#degrees of freedomp Hide
#F-stat and its p-valueMSR [1] 280.5283************all code below use CTRL+F "hide" to find where my code starts************
rm(list=ls())library(lattice)data("Guns")library(AER)library(DAAG)library(dplyr)library(ggplot2)str(Guns)'data.frame': 1173 obs. of 13 variables: $ year : Factor w/ 23 levels "1977","1978",..: 1 2 3 4 5 6 7 8 9 10 ... $ violent : num 414 419 413 448 470 ... $ murder : num 14.2 13.3 13.2 13.2 11.9 10.6 9.2 9.4 9.8 10.1 ... $ robbery : num 96.8 99.1 109.5 132.1 126.5 ... $ prisoners : int 83 94 144 141 149 183 215 243 256 267 ... $ afam : num 8.38 8.35 8.33 8.41 8.48 ... $ cauc : num 55.1 55.1 55.1 54.9 54.9 ... $ male : num 18.2 18 17.8 17.7 17.7 ... $ population: num 3.78 3.83 3.87 3.9 3.92 ... $ income : num 9563 9932 9877 9541 9548 ... $ density : num 0.0746 0.0756 0.0762 0.0768 0.0772 ... $ state : Factor w/ 51 levels "Alabama","Alaska",..: 1 1 1 1 1 1 1 1 1 1 ... $ law : Factor w/ 2 levels "no","yes": 1 1 1 1 1 1 1 1 1 1 ...Hide
sum(is.na(Guns))[1] 0Hide
pairs(~ violent + state + year + law , data = Guns, main = "Scatterplot Matrix")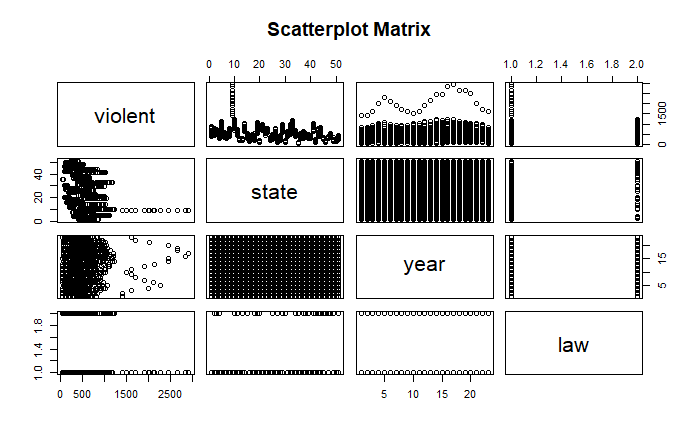


Step by Step Solution
There are 3 Steps involved in it
1 Expert Approved Answer
Step: 1 Unlock

Question Has Been Solved by an Expert!
Get step-by-step solutions from verified subject matter experts
Step: 2 Unlock
Step: 3 Unlock