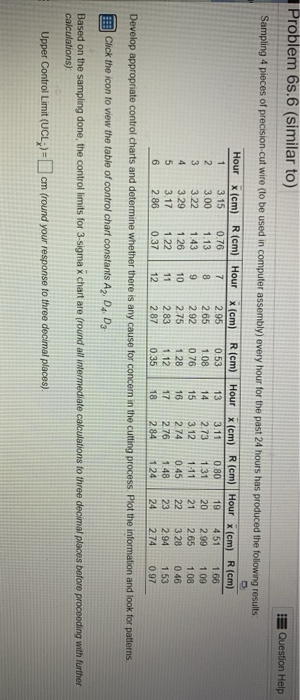
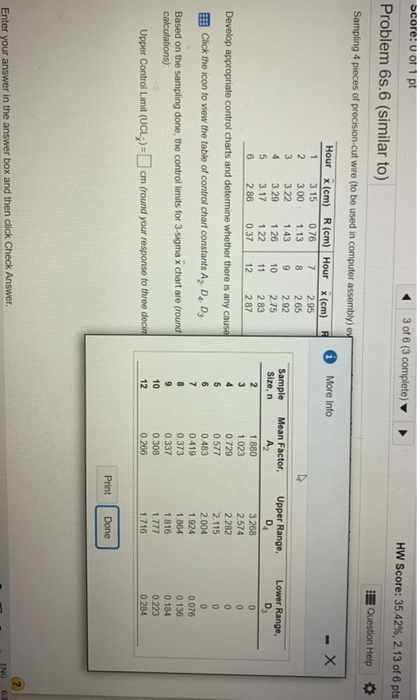
Question: can you please help me answer this Problem 6s.6 (similar to) Question Help Sampling 4 pieces of precision-cut wire (to be used in computer assembly)

can you please help me answer this
can you please help me answer this Problem 6s.6
Problem 6s.6 (similar to) Question Help Sampling 4 pieces of precision-cut wire (to be used in computer assembly) every hour for the past 24 hours has produced the following results R (cm) 0.76 Hour X (cm) R (cm) Hour 1 3.15 7 2 3.00 1.13 8 3 3.22 1.43 9 4 3.29 1.26 10 5 3.17 122 11 6 2.86 0 37 12 X (cm) 2.95 2.65 2.92 2.75 2.83 2.87 0.53 1.08 0.76 1 28 112 0.35 Hour (cm) R (cm) Hour x (cm) R (cm) 13 3.11 0.80 19 4.51 1.66 14 2.73 1.31 20 2.99 109 15 3.12 1:11 21 2.65 1.08 16 0.45 22 3.28 0.46 17 2.76 1.48 23 2.94 1.53 18 284 1.24 24 2.74 0.97 2.74 Develop appropriate control charts and determine whether there is any cause for concern in the cutting process Plot the information and look for patterns Click the icon to view the table of control chart constants A7, D D Based on the sampling done, the control limits for 3-sigma x chart are (round all intermediate calculations to three decimal places before proceeding with further calculations) Upper Control Limit (UCL;)=cm (round your response to three decimal places). HW Score: 35.42%, 2.13 of 6 pts Question Help 7 8 9 3 1.43 Score: 0 or 1 pt 3 of 6 (3 complete) Problem 6s.6 (similar to) Sampling 4 pieces of precision-cut wire to be used in computer assembly) ey Hour x (cm) R (cm) Hour More Info x (cm) 1 3.15 0.76 2.95 2 3.00 1.13 2.65 3.22 2.92 Sample Mean Factor, 4 3.29 1.26 10 2.75 Size, n 5 3.17 A2 1.22 11 2.83 6 2 2.86 0.37 12 1.880 2.87 3 1.023 Develop appropriate control charts and determine whether there is any cause 0.729 0 577 Click the icon to view the table of control chart constants A, D, D, 0483 0.419 Based on the sampling done, the control limits for 3-sigma 3 chart are (round 0.373 calculations) 0.337 0.308 Upper Control Limit (UCL.;)=cm (round your response to three decim 0 266 5 6 7 8 9 10 12 Upper Range, D 3.268 2.574 2282 2. 115 2004 1.924 1.864 1.816 1.777 1.716 Lower Range, D 0 0 0 0 0 0.076 0.136 0.184 0.223 0.284 Print Done Enter your answer in the answer box and then click Check Answer. ING

Step by Step Solution

There are 3 Steps involved in it

1 Expert Approved Answer
Step: 1 Unlock blur-text-image
Question Has Been Solved by an Expert!

Get step-by-step solutions from verified subject matter experts

Step: 2 Unlock
Step: 3 Unlock

Students Have Also Explored These Related General Management Questions!