

Question: Can you please help me interpret what these 3 statistical output results mean? The context is the indepdent variable is about Diamond Prices and the
Can you please help me interpret what these 3 statistical output results mean?
The context is the indepdent variable is about Diamond Prices and the Depden variables seen on the left are Diamond Depth and Diamond Carat.
What does the T stat mean in the 3 figures below? What about the P value meaning? Std Error? Coefficient?
Thank you so much !!!
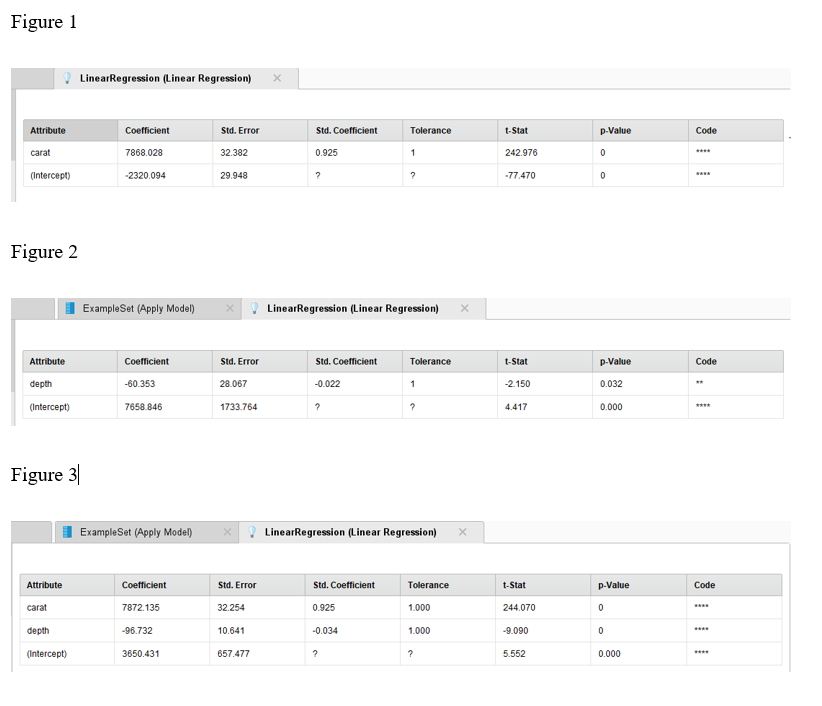
Figure 1 LinearRegression (Linear Regression) X Attribute Coefficient Sid. Error Std. Coefficient Tolerance 1-Stat p-Value Code 7868.028 32.382 0.925 242.976 0 29.948 -77.470 (Intercept) 2320.094 Figure 2 ExampleSet (Apply Model) X LinearRegression (Linear Regression) X Coefficient Tolerance -Stat p-Value Code Attribute Sid. Error Sid. Coefficient depth -60.353 28.067 -0.022 -2.150 0.032 1733.764 4.417 0.000 (Intercept) 7658 846 Figure 3 ExampleSet (Apply Model) X LinearRegression (Linear Regression) X Std. Error Tolerance t-Stat p-Value Attribute Coefficient Std. Coefficient Code carat 7872.135 32.254 0.925 1.000 244.070 depth -96.732 10.641 -0.034 1.000 -9.090 (Intercept) 3650.431 657.477 5.552 0.000
Step by Step Solution
There are 3 Steps involved in it

Get step-by-step solutions from verified subject matter experts