

Question: can you please help me solve this step by step. no excel solutions pls 1. a. Describe with graphical illustration how the economic life of
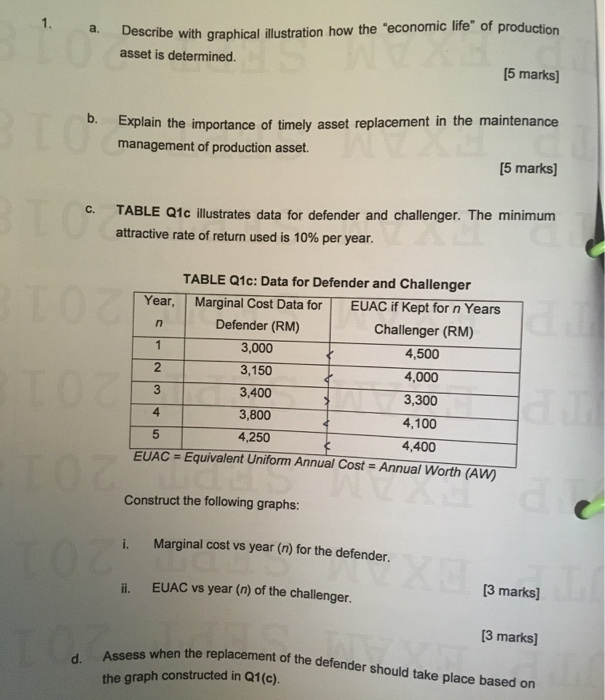
1. a. Describe with graphical illustration how the "economic life" of production Describe with graphica asset is determined. [5 marks] 0. Explain the importance of timely asset replacement in the maintenance management of production asset. [5 marks] C. TABLE Q1c illustrates data for defender and challenger. The minimum attractive rate of return used is 10% per year. TABLE Q1c: Data for Defender and Challenger Year, Marginal Cost Data for EUAC if Kept for n Years Defender (RM) Challenger (RM) 3,000 4,500 3,150 4,000 3,400 3,300 3,800 4,100 4,250 4,400 EUAC = Equivalent Uniform Annual Cost = Annual Worth (AW) Construct the following graphs: i Marginal cost vs year (n) for the defender ii. EUAC vs year (n) of the challenger. [3 marks] [3 marks] d. the replacement of the defender should take place based on Assess when the replacem the graph constructed in Q1(c)
Step by Step Solution
There are 3 Steps involved in it

Get step-by-step solutions from verified subject matter experts