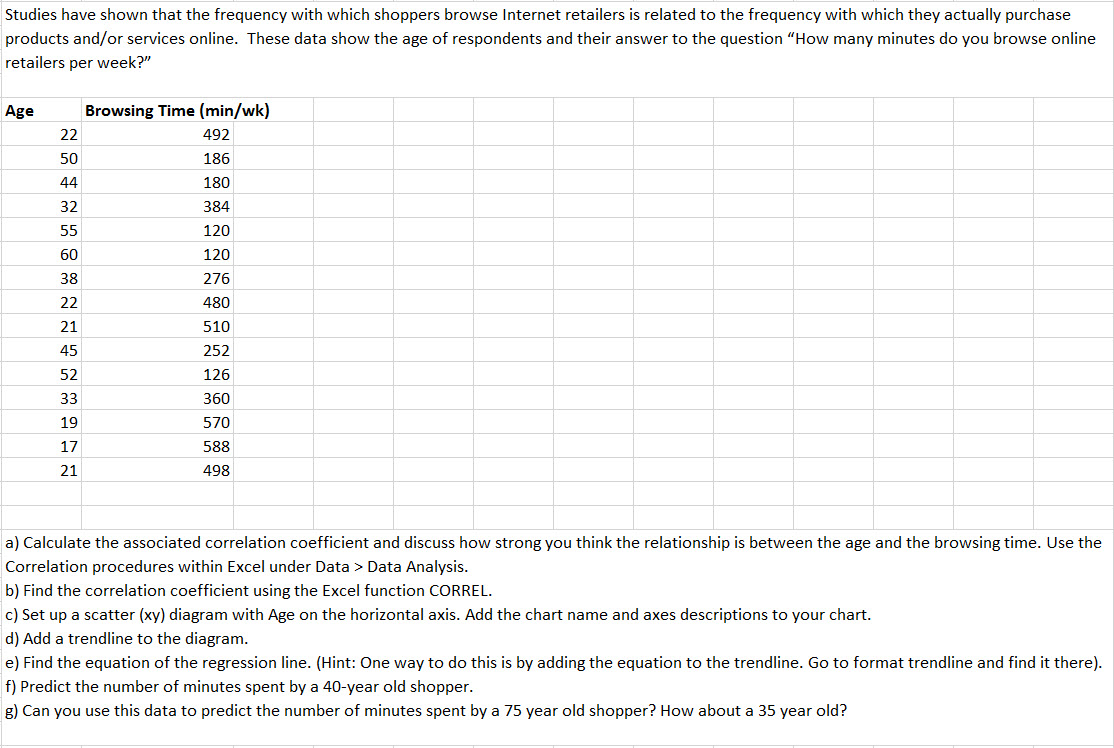
Question: Can you please help me to create an excel document for this question? Studies have shown that the frequency with which shoppers browse internet retailers

Can you please help me to create an excel document for this question?

Can you please help me to create an excel
Studies have shown that the frequency with which shoppers browse internet retailers is related to the frequency with which they actually purchase products and/or services online. These data show the age of respondents and their answer to the question \"How many minutes do you browse online retailers per week?\" Age Browsing Time [minlwkl 22 492 50 135 44 130 32 334 55 120 50 120 33 225 22 430 21 519 45 252 52 125 33 350 19 579 17 533 21 493 a} Calculate the associated correlation coefficient and discuss how strong you think the relationship is between the age and the browsing time. Use the I Correlation procedures within Excel under Data > Data Analysis. b} Find the correlation coefficient using the Excel function CORREL. c} Set up a scatter (xy} diagram with Age on the horizontal axis. Add the chart name and axes descriptions to your chart. d} Add a trendline to the diagram. e} Find the equation of the regression line. (Hint: One way to do this is by adding the equation to the trendline. Go to format trendline and find it there}. f} Predict the number of minutes spent by a 40year old shopper. g} Can you use this data to predict the number of minutes spent by a 75 year old shopper? How about a 35 year old

Step by Step Solution

There are 3 Steps involved in it

1 Expert Approved Answer
Step: 1 Unlock blur-text-image
Question Has Been Solved by an Expert!

Get step-by-step solutions from verified subject matter experts

Step: 2 Unlock
Step: 3 Unlock

Students Have Also Explored These Related Mathematics Questions!