Question: Can you please help me understand my coding and results. Doing a project on if gun laws correlate to higher violent crime rate Done on
Can you please help me understand my coding and results. Doing a project on if gun laws correlate to higher violent crime rate
Done on R-studio
Code below:
rm(list=ls())library(lattice)data("Guns")library(AER)library(DAAG)library(dplyr)library(ggplot2)str(Guns)
'data.frame': 1173 obs. of 13 variables: $ year : Factor w/ 23 levels "1977","1978",..: 1 2 3 4 5 6 7 8 9 10 ... $ violent : num 414 419 413 448 470 ... $ murder : num 14.2 13.3 13.2 13.2 11.9 10.6 9.2 9.4 9.8 10.1 ... $ robbery : num 96.8 99.1 109.5 132.1 126.5 ... $ prisoners : int 83 94 144 141 149 183 215 243 256 267 ... $ afam : num 8.38 8.35 8.33 8.41 8.48 ... $ cauc : num 55.1 55.1 55.1 54.9 54.9 ... $ male : num 18.2 18 17.8 17.7 17.7 ... $ population: num 3.78 3.83 3.87 3.9 3.92 ... $ income : num 9563 9932 9877 9541 9548 ... $ density : num 0.0746 0.0756 0.0762 0.0768 0.0772 ... $ state : Factor w/ 51 levels "Alabama","Alaska",..: 1 1 1 1 1 1 1 1 1 1 ... $ law : Factor w/ 2 levels "no","yes": 1 1 1 1 1 1 1 1 1 1 ...
Hide
sum(is.na(Guns))
[1] 0
Hide
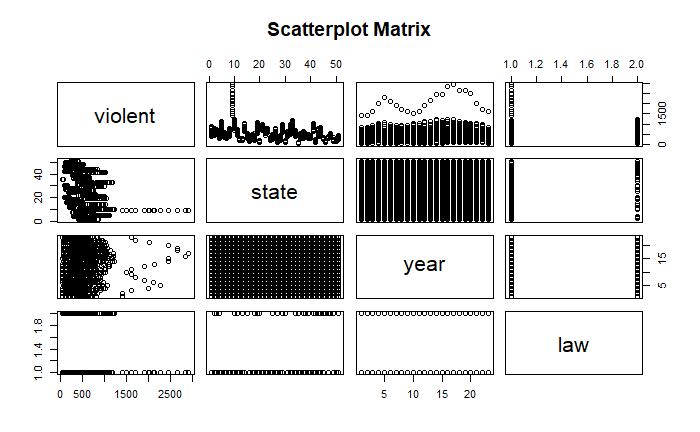
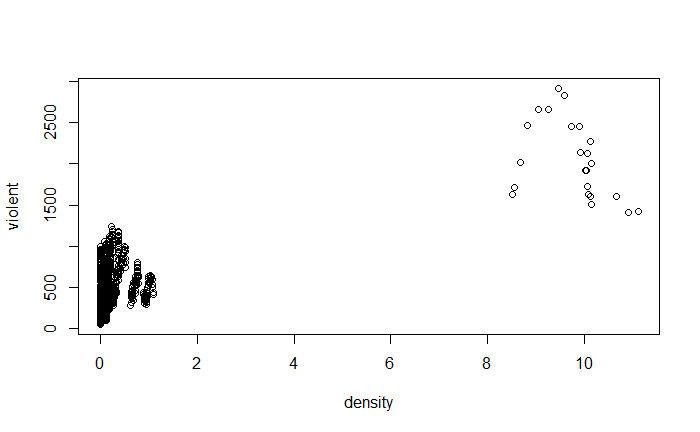
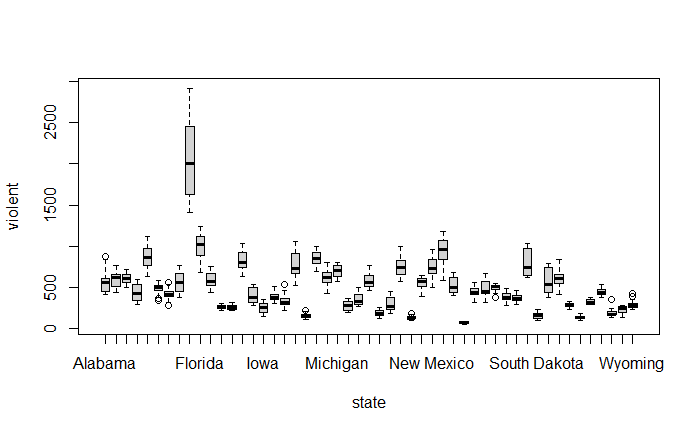
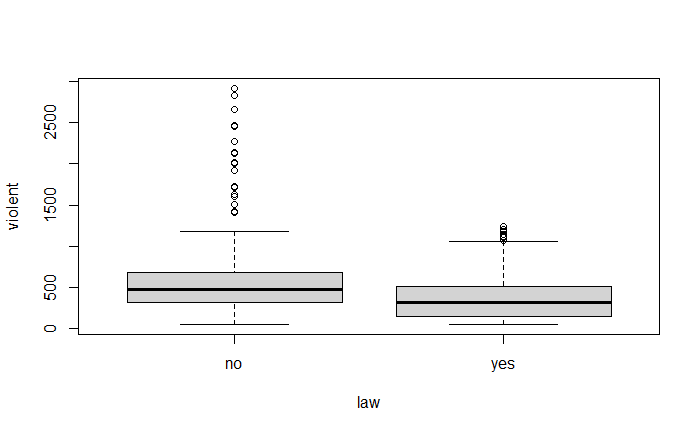
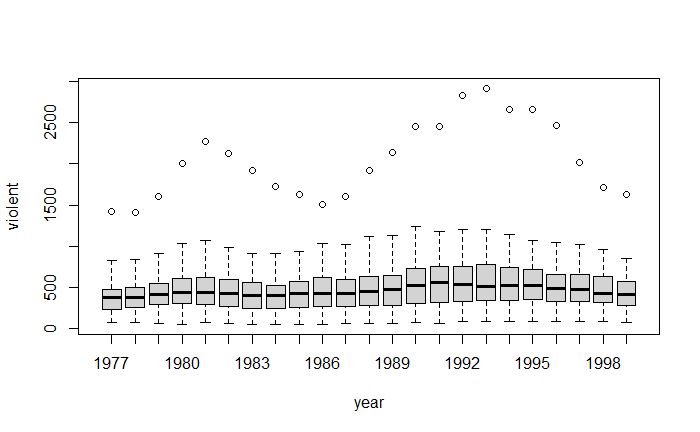
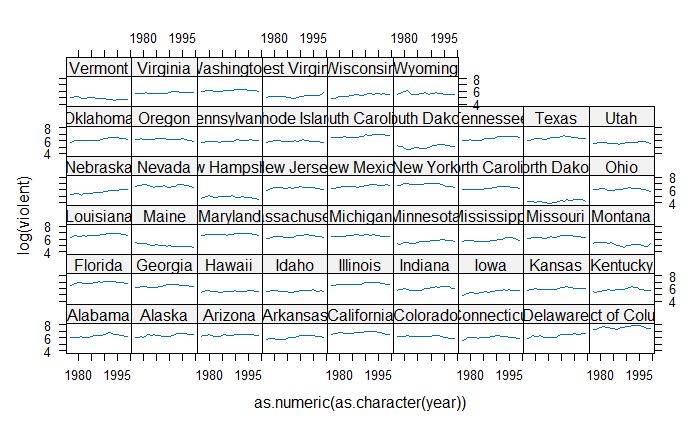
pairs(~ violent + state + year + law , data = Guns, main = "Scatterplot Matrix")
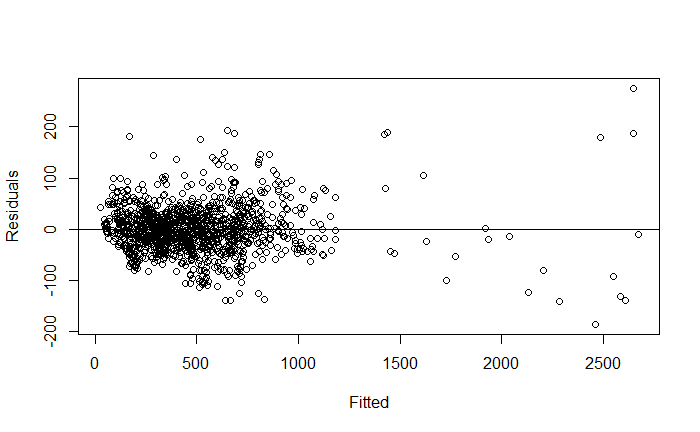
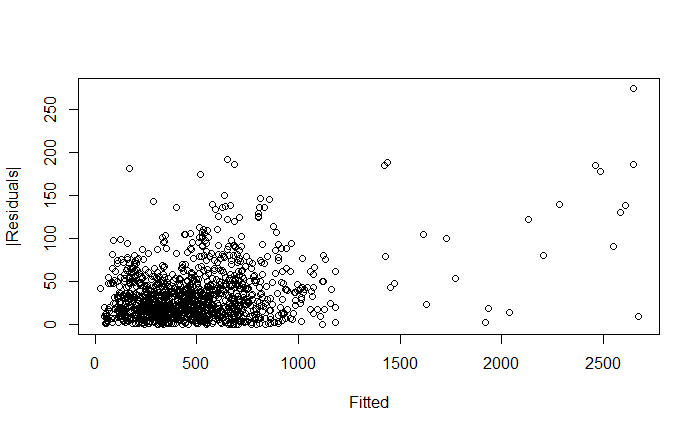
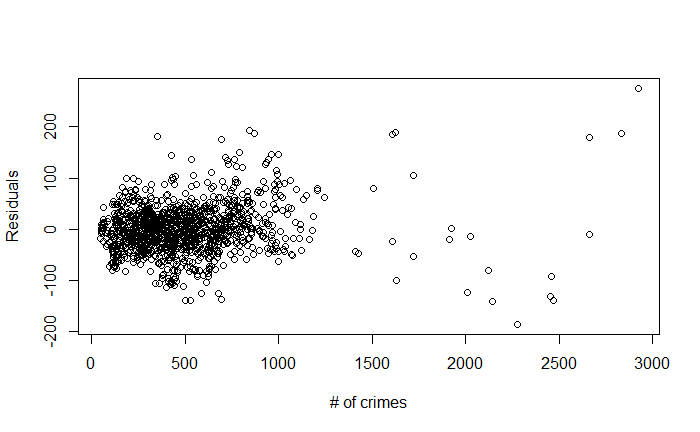
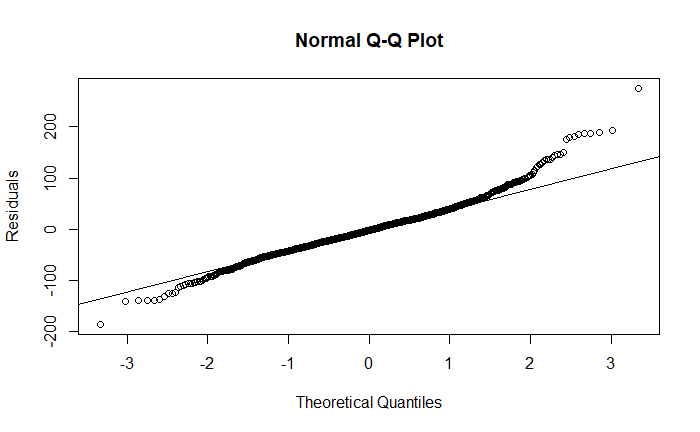
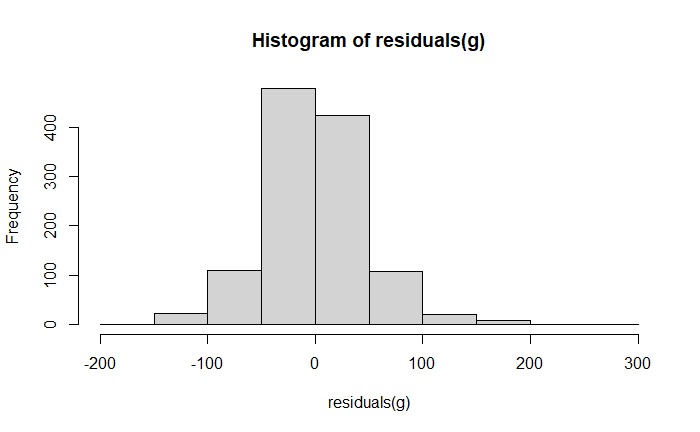
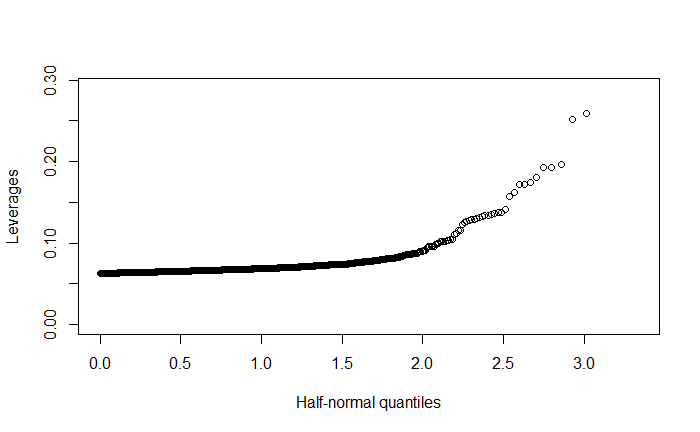
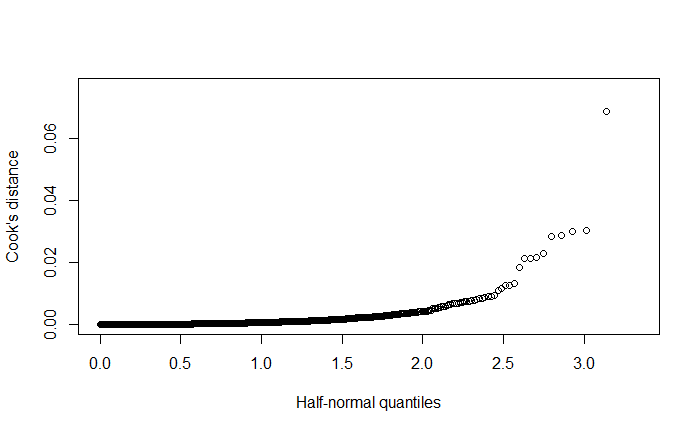
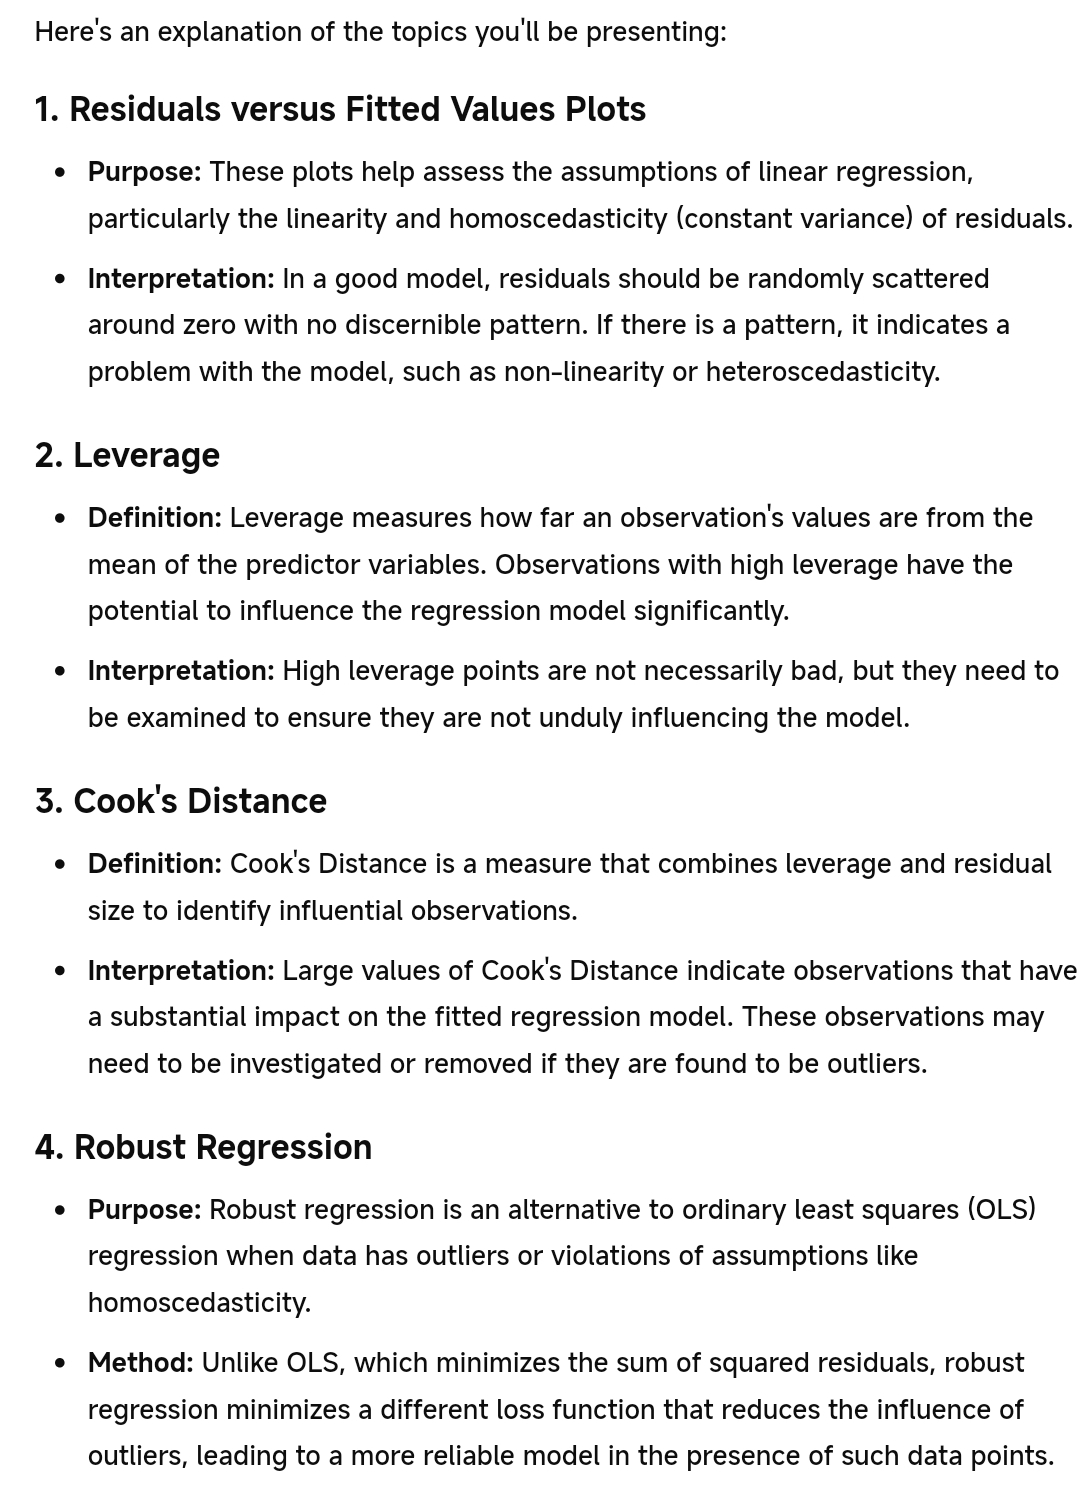
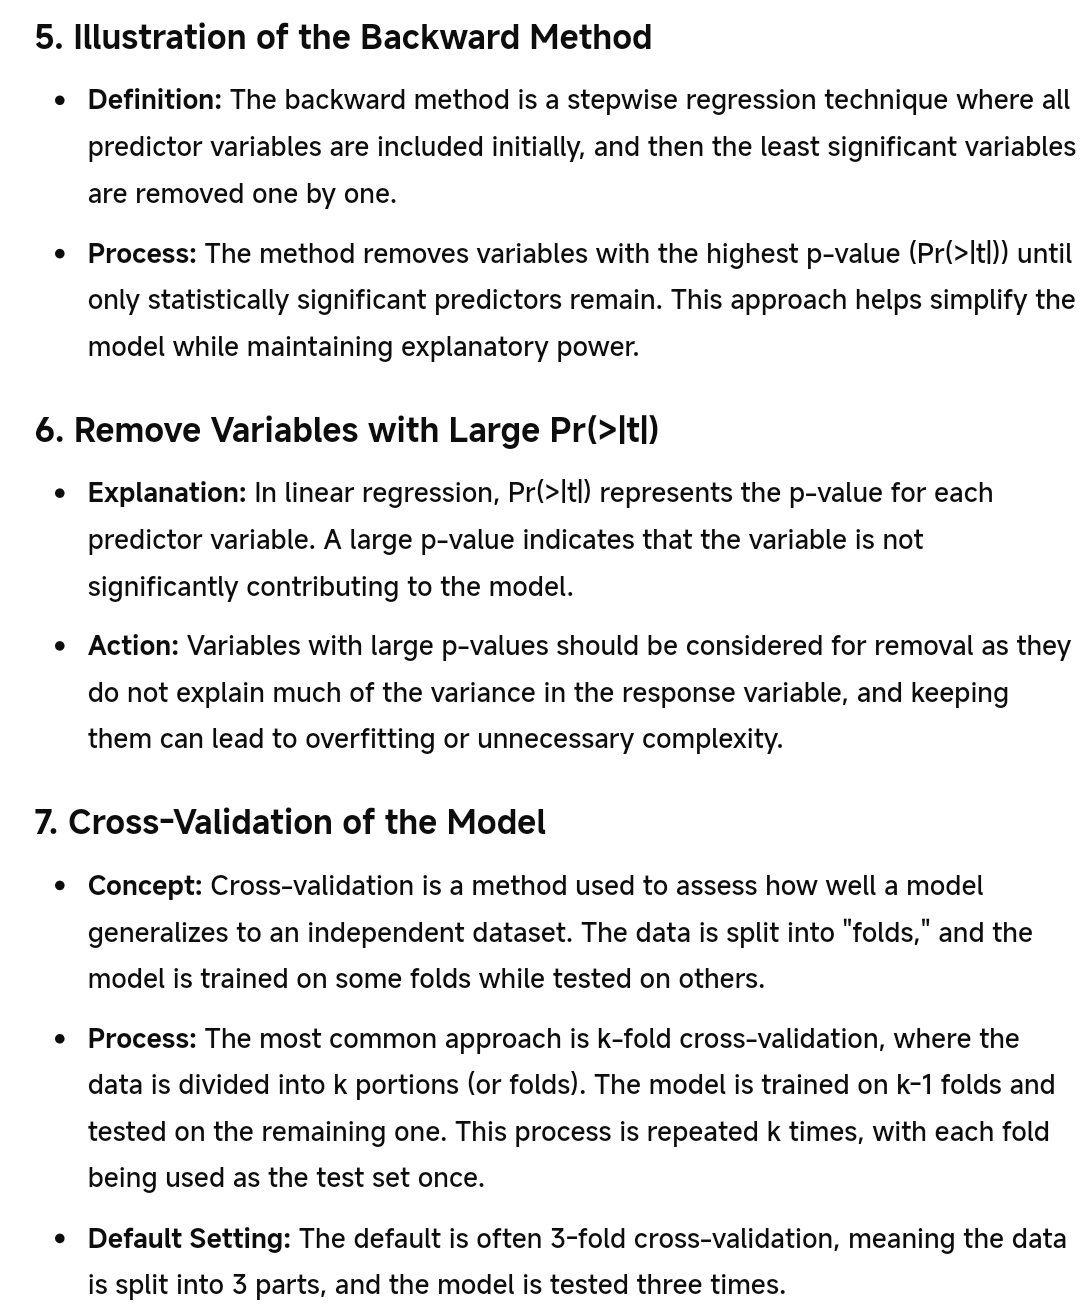
\f\fO O O 50 100 150 200 250 |Residuals) O O OC O O O O O O O O O O O O O O O 500 1000 1500 2000 2500 Fitted\f\f\f\f\f\f\f\f\f\f\f\f\f\f\f\f\f\f\f\f\f\fHere's an explanation of the topics you'll be presenting: 1. Residuals versus Fitted Values Plots e Purpose: These plots help assess the assumptions of linear regression, particularly the linearity and homoscedasticity (constant variance) of residuals. e Interpretation: In a good model, residuals should be randomly scattered around zero with no discernible pattern. If there is a pattern, it indicates a problem with the model, such as non-linearity or heteroscedasticity. 2. Leverage Definition: Leverage measures how far an observation's values are from the mean of the predictor variables. Observations with high leverage have the potential to influence the regression model significantly. e Interpretation: High leverage points are not necessarily bad, but they need to be examined to ensure they are not unduly influencing the model. 3. Cook's Distance Definition: Cook's Distance is a measure that combines leverage and residual size to identify influential observations. Interpretation: Large values of Cook's Distance indicate observations that have a substantial impact on the fitted regression model. These observations may need to be investigated or removed if they are found to be outliers. 4. Robust Regression e Purpose: Robust regression is an alternative to ordinary least squares (OLS) regression when data has outliers or violations of assumptions like homoscedasticity. e Method: Unlike OLS, which minimizes the sum of squared residuals, robust regression minimizes a different loss function that reduces the influence of outliers, leading to a more reliable model in the presence of such data points. 5. lllustration of the Backward Method Definition: The backward method is a stepwise regression technique where all predictor variables are included initially, and then the least significant variables are removed one by one. Process: The method removes variables with the highest p-value (Pr(>Itl)) until only statistically significant predictors remain. This approach helps simplify the model while maintaining explanatory power. 6. Remove Variables with Large Pr(>ltl) Explanation: In linear regression, Pr(>Itl) represents the p-value for each predictor variable. A large p-value indicates that the variable is not significantly contributing to the model. Action: Variables with large p-values should be considered for removal as they do not explain much of the variance in the response variable, and keeping them can lead to overfitting or unnecessary complexity. 7. Cross-Validation of the Model e Concept: Cross-validation is a method used to assess how well a model generalizes to an independent dataset. The data is split into "folds," and the model is trained on some folds while tested on others. Process: The most common approach is k-fold cross-validation, where the data is divided into k portions (or folds). The model is trained on k-1 folds and tested on the remaining one. This process is repeated k times, with each fold being used as the test set once. Default Setting: The default is often 3-fold cross-validation, meaning the data is split into 3 parts, and the model is tested three times