

Question: Can you please help me with the below? 5. value: 8.00 points Using the demand schedule below, plot the demand curve on the graph and
Can you please help me with the below?
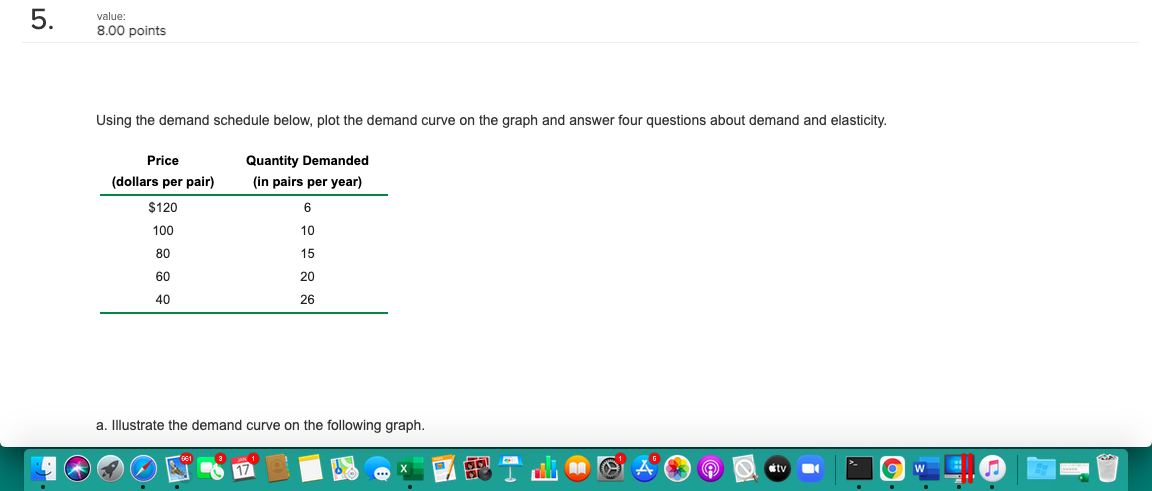
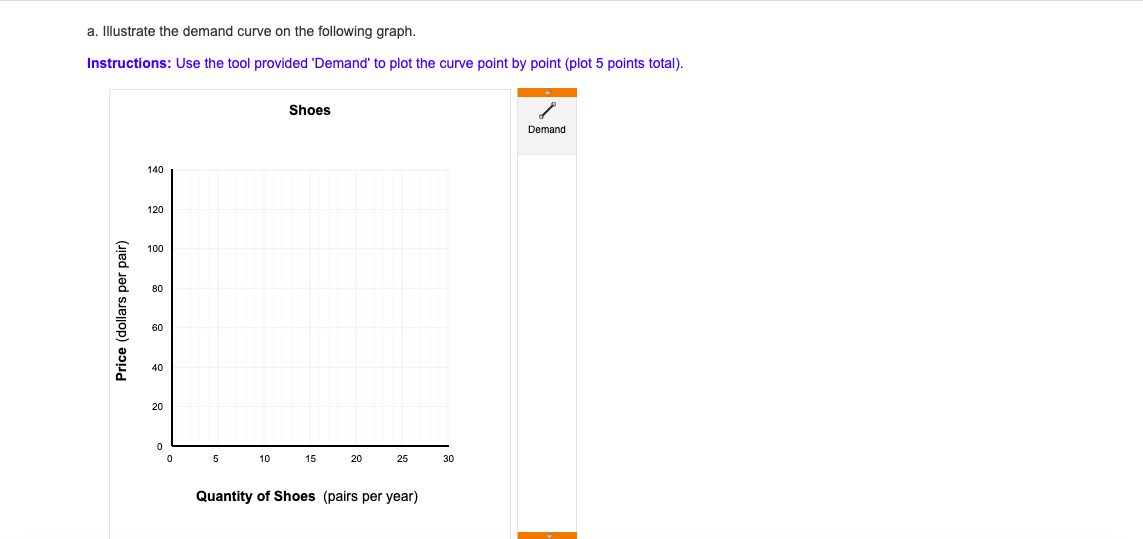
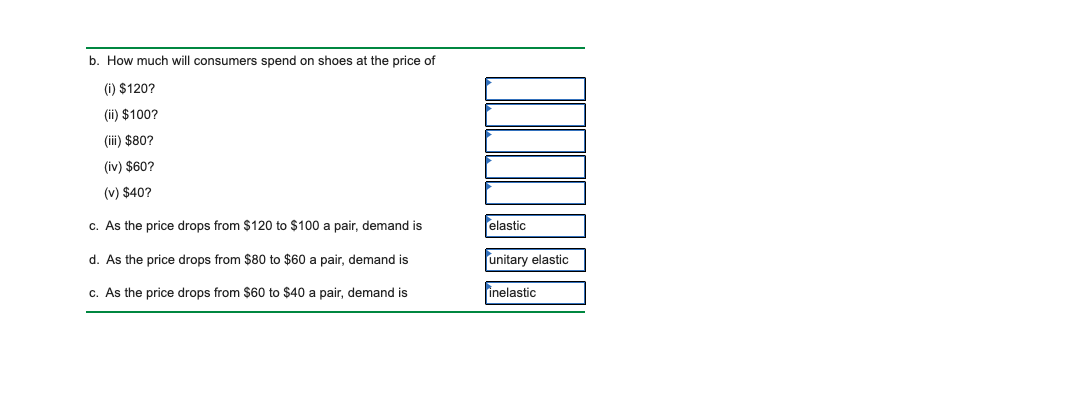
5. value: 8.00 points Using the demand schedule below, plot the demand curve on the graph and answer four questions about demand and elasticity. Price Quantity Demanded (dollars per pair) (in pairs per year) $120 6 100 10 80 15 60 20 40 26 a. Illustrate the demand curve on the following graph. 17 X O Wa. Illustrate the demand curve on the following graph. Instructions: Use the tool provided 'Demand' to plot the curve point by point (plot 5 points total). Shoes Demand 140 120 100 80 Price (dollars per pair) 60 40 20 0 5 10 15 20 25 30 Quantity of Shoes (pairs per year)b. How much will consumers spend on shoes at the price of (i) 3120'? (ii) $100? (iii) $80? (iv) $60? (v) $40? c. As the price drops from $120 to $100 a pair, demand is d. As the price drops from $80 to $60 a pair, demand is c. As the price drops from $60 to $40 a pair, demand is elastic unitary elastic IIIHHHHH Inelastic
Step by Step Solution
There are 3 Steps involved in it

Get step-by-step solutions from verified subject matter experts