

Question: Can you please help me with the problem shown in the attached screenshot? The chart below shows the percentage of people in a questionnaire who
Can you please help me with the problem shown in the attached screenshot?
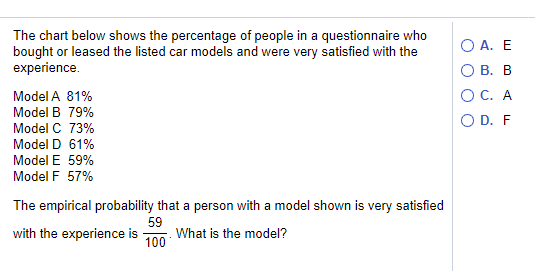
The chart below shows the percentage of people in a questionnaire who bought or leased the listed car models and were very satisfied with the OA. E experience. OB. B Model A 81% OC. A Model B 79% Model C 73% OD. F Model D 61% Model E 59% Model F 57% The empirical probability that a person with a model shown is very satisfied 59 with the experience is What is the model? 100
Step by Step Solution
There are 3 Steps involved in it
1 Expert Approved Answer
Step: 1 Unlock

Question Has Been Solved by an Expert!
Get step-by-step solutions from verified subject matter experts
Step: 2 Unlock
Step: 3 Unlock