

Question: Can you please help me with this question? The regression results below are for data on Studying Science, the Y variable in the regression, and
Can you please help me with this question?
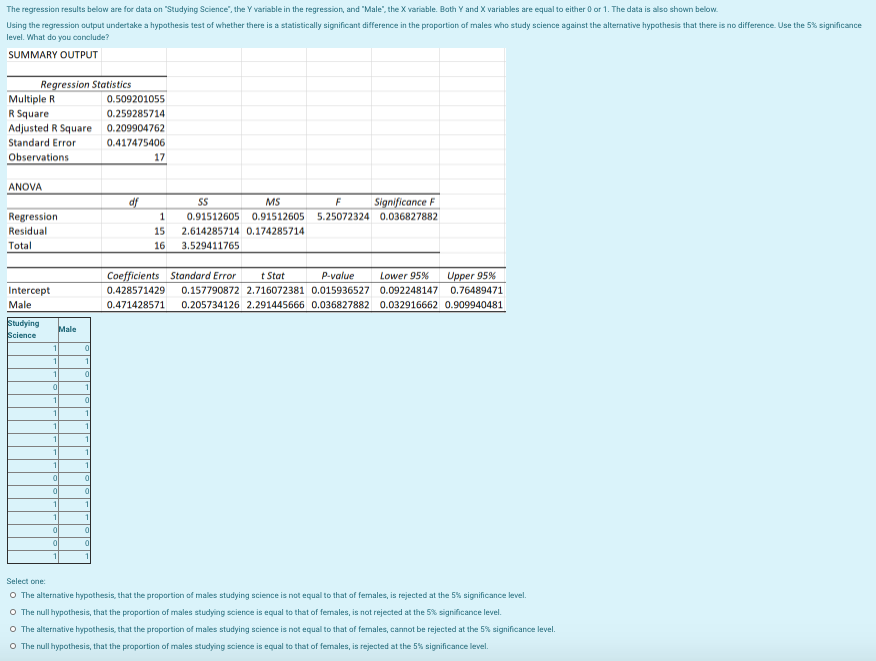
The regression results below are for data on "Studying Science", the Y variable in the regression, and "Male". the X variable. Both Y and X variables are equal to either 0 or 1. The data is also shown below. Using the regression output undertake a hypothesis test of whether there is a statistically significant difference in the proportion of males who study science against the alternative hypothesis that there is no difference. Use the 5% significance level. What do you conclude? SUMMARY OUTPUT Regression Statistics Multiple R 0.509201055 R Square 0.259285714 Adjusted R Square 0.209904762 Standard Error 0.417475406 Observations 17 ANOVA 55 MS F Significance F Regression 1 0.91512605 0.91512605 5.25072324 0.036827882 Residual 15 2.614285714 0.174285714 Total 16 3.529411765 Coefficients Standard Error Stat P-value Lower 95% Upper 95% Intercept 0.428571429 0.157790872 2.716072381 0.015936527 0.092248147 0.76489471 Male 0.471428571 0.205734126 2.291445666 0.036827882 0.032916662 0.909940481 Studying Science Male Select one: O The alternative hypothesis, that the proportion of males studying science is not equal to that of females, is rejected at the 5% significance level. O The null hypothesis, that the proportion of males studying science is equal to that of females, is not rejected at the 5% significance level. The alternative hypothesis, that the proportion of males studying science is not equal to that of females, cannot be rejected at the 5% significance level. The null hypothesis, that the proportion of males studying science is equal to that of females, is rejected at the 5% significance level
Step by Step Solution
There are 3 Steps involved in it

Get step-by-step solutions from verified subject matter experts