

Question: Can you please help solve and explain? @ Homepage - Fall 2021 Business C X Assignments X Lesson 4.3 Certify Mode Question X Course Hero
Can you please help solve and explain?
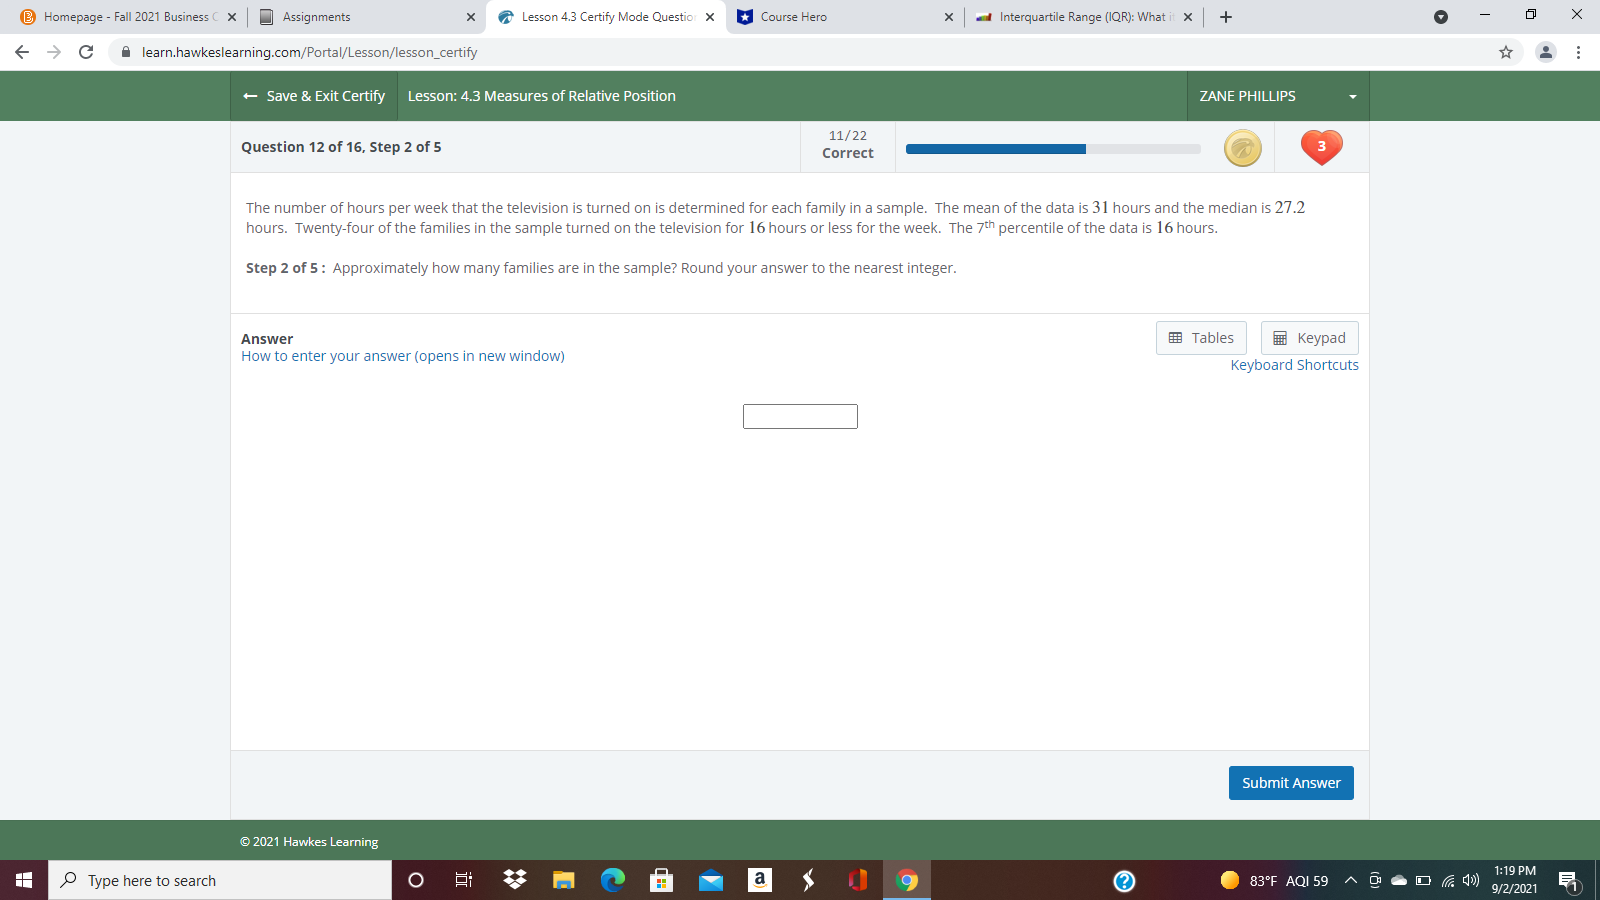
@ Homepage - Fall 2021 Business C X Assignments X Lesson 4.3 Certify Mode Question X Course Hero X andInterquartile Range (IQR): What it X + X - > C A learn.hawkeslearning.com/Portal/Lesson/lesson_certify + Save & Exit Certify Lesson: 4.3 Measures of Relative Position ZANE PHILLIPS 11/22 Question 12 of 16, Step 2 of 5 Correct The number of hours per week that the television is turned on is determined for each family in a sample. The mean of the data is 31 hours and the median is 27.2 hours. Twenty-four of the families in the sample turned on the television for 16 hours or less for the week. The 7th percentile of the data is 16 hours. Step 2 of 5 : Approximately how many families are in the sample? Round your answer to the nearest integer. Answer Tables Keypad How to enter your answer (opens in new window) Keyboard Shortcuts Submit Answer @ 2021 Hawkes Learning Type here to search O 9 ? 83.F AQI 59 1:19 PM 9/2/2021
Step by Step Solution
There are 3 Steps involved in it

Get step-by-step solutions from verified subject matter experts