

Question: Can you please help to solve this? Probability In 2013. the Public Religion Research Institute conducted a survey of 1,033 adults, 18 years of a
Can you please help to solve this? Probability
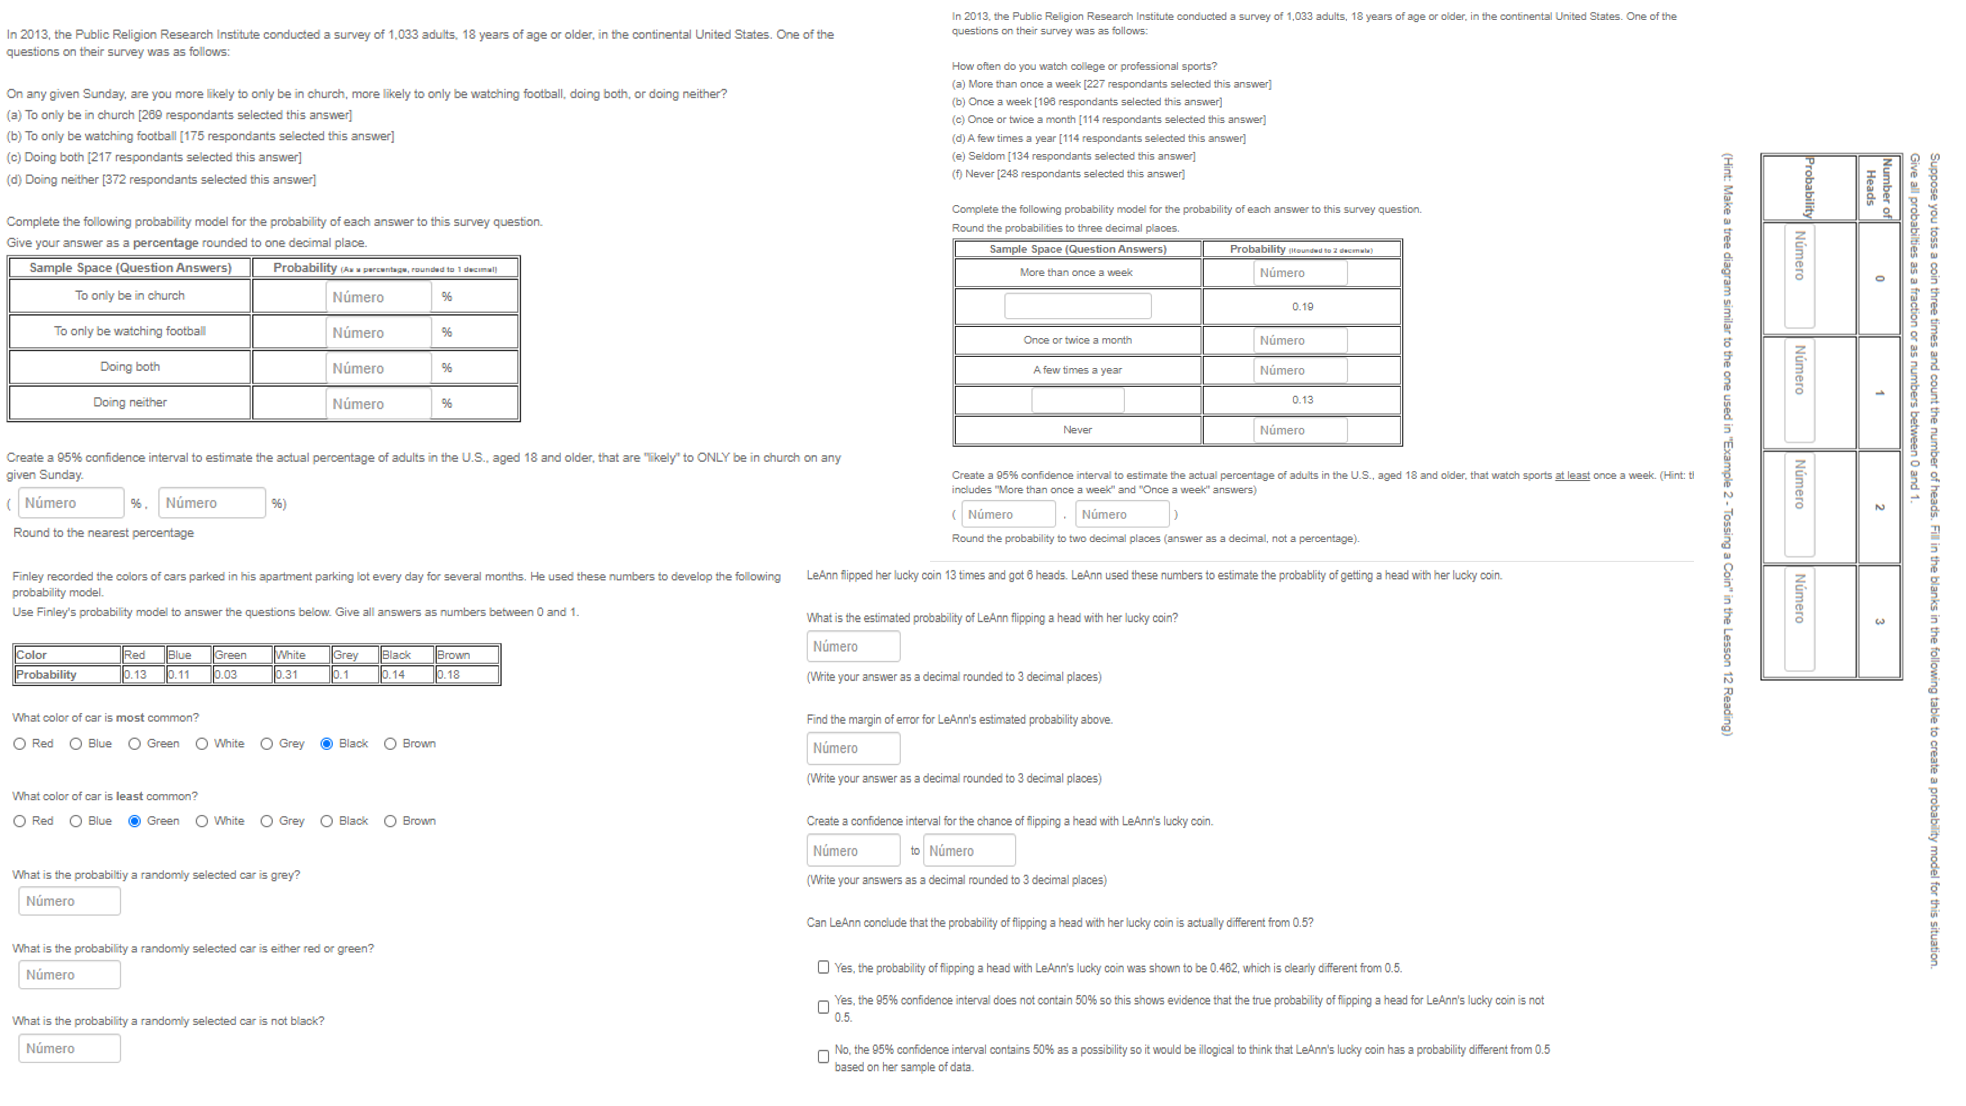
In 2013. the Public Religion Research Institute conducted a survey of 1,033 adults, 18 years of a United States. One of the In 2013, the Public Religion Research Institute conducted a survey of 1.033 adults. 18 years of age or older, in the continental United States. One of the questions on their survey was as follows: questions on their survey was as follows: How often do you watch college or professional sports? On any given Sunday, are you more likely to only be in church, more likely to only be watching football, doing both, or doing neither? (a) More than once a week [227 respondants selected this answer] (a) To only be in church [260 respondants selected this answer] (b) Once a week [198 respo (c) Once or twice a month [114 res pondants selected this answer] (b) To only be watching football [175 respondants selected this answer] (d) A few times a year [114 respond ected this answer] (c) Doing both [217 respondants sele ted this answer] (e) Seldom [134 resp this answer] (d) Doing neither [372 respondants selected this answer] (f) Never [248 respondants selected this answer] Complete the following probability model for the probability of each answer to this survey question. Complete the following probability model for the probability of each answer to this survey question. Probability Heads Number of Round the probabilities to three decimal places. Give your answer as a percentage rounded to one decimal place. Sample Space (Question Answers) Probability (hounded to 2 deemnuts) Sample Space (Question Answers) Probability (Aww percentage, rounded to 1 decimal) More than once a week Numero (Hint: Make a tree diagram Numero O To only be in church Numero 96 0.18 To only be watching football Numero 96 Once or twice a month Numero Doing both Numero 9% A few times a year Numero Doing neither Numero 9% 0.1 Numero Never Numero Create a 95% confidence interval to estimate the actual percentage of adults in the U.S., aged 18 and older, that are "likely" to ONLY be in church on any given Sunday. Create a 95% confidence interval to estimate the actual percentage of adults in the U.S., aged 18 and older. that watch sports at least once a week. (Hint: ti ( Numero 96 . Numero 96 ) includes "More than once a week" and "Once a week" answers) Give all probabilties as a fraction or as numbers between 0 and 1. ( Numero . Numero Numero N Round to the nearest percentage Round the probability to two decimal places (answer as a decimal, not a percentage). Finley recorded the colors of cars parked in his apartment parking lot every day for several months. He used these numbers to develop the following LeAnn flipped her lucky coin 13 times and got 6 heads. LeAnn used these numbers to estimate the probably of getting a head with her lucky coin. probability model. Use Finley's probability model to answer the questions below. Give all answers as numbers between 0 and 1. What is the estimated probability of LeAnn flipping a head with her lucky coin? Numero w Color Red d Blue Green White Grey Black Brown Numero Probability D. 13 0.11 0.03 10.31 0.1 D. 14 10.18 Write your answer as a decimal rounded to 3 decimal places) What color of car is most common? Find the margin of error for LeAnn's estimated probability above. similar to the one used in "Example 2 - Tossing a Coin" in the Lesson 12 Reading) Suppose you toss a coin three times and count the number of heads. Fill in the blanks in the follow O Red O Blue O Green O White O Grey ( Black O Brown Numero (Write your answer as a decimal rounded to 3 decimal places) What color of car is least common? Red O Blue Green O White O Grey ( Black O Brown Create a confidence interval for the chance of flipping a head with LeAnn's lucky coin. Numero to Numero What is the probabiltiy a randomly selected car is grey? (Write your answers as a decimal rounded to 3 decimal places) Numero Can LeAnn conclude that the probability of flipping a head with her lucky coin is actually different from 0.5? What is the probability a randomly selected car is either red or green? table to create a probability model for this situation. Numero O Yes, the probability of flipping a head with LeAnn's lucky coin was shown to be 0.482, which is clearly different from 0.5. Yes, the 95% confidence interval does not contain 50% so this shows evidence that the true probability of flipping a head for LeAnn's lucky coin is not What is the probability a randomly selected car is not black? 0.5. Numero ON No. the 95% confidence interval contains 50% as a possibility so it would be illogical to think that LeAnn's lucky coin has a probability different from 0.5 based on her sample of data
Step by Step Solution
There are 3 Steps involved in it

Get step-by-step solutions from verified subject matter experts