

Question: can you please help with this project File Edit View Insert Format Tools Table Window Help SatJan3012137PM Q AutoSave . r' f} E Q :
can you please help with this project
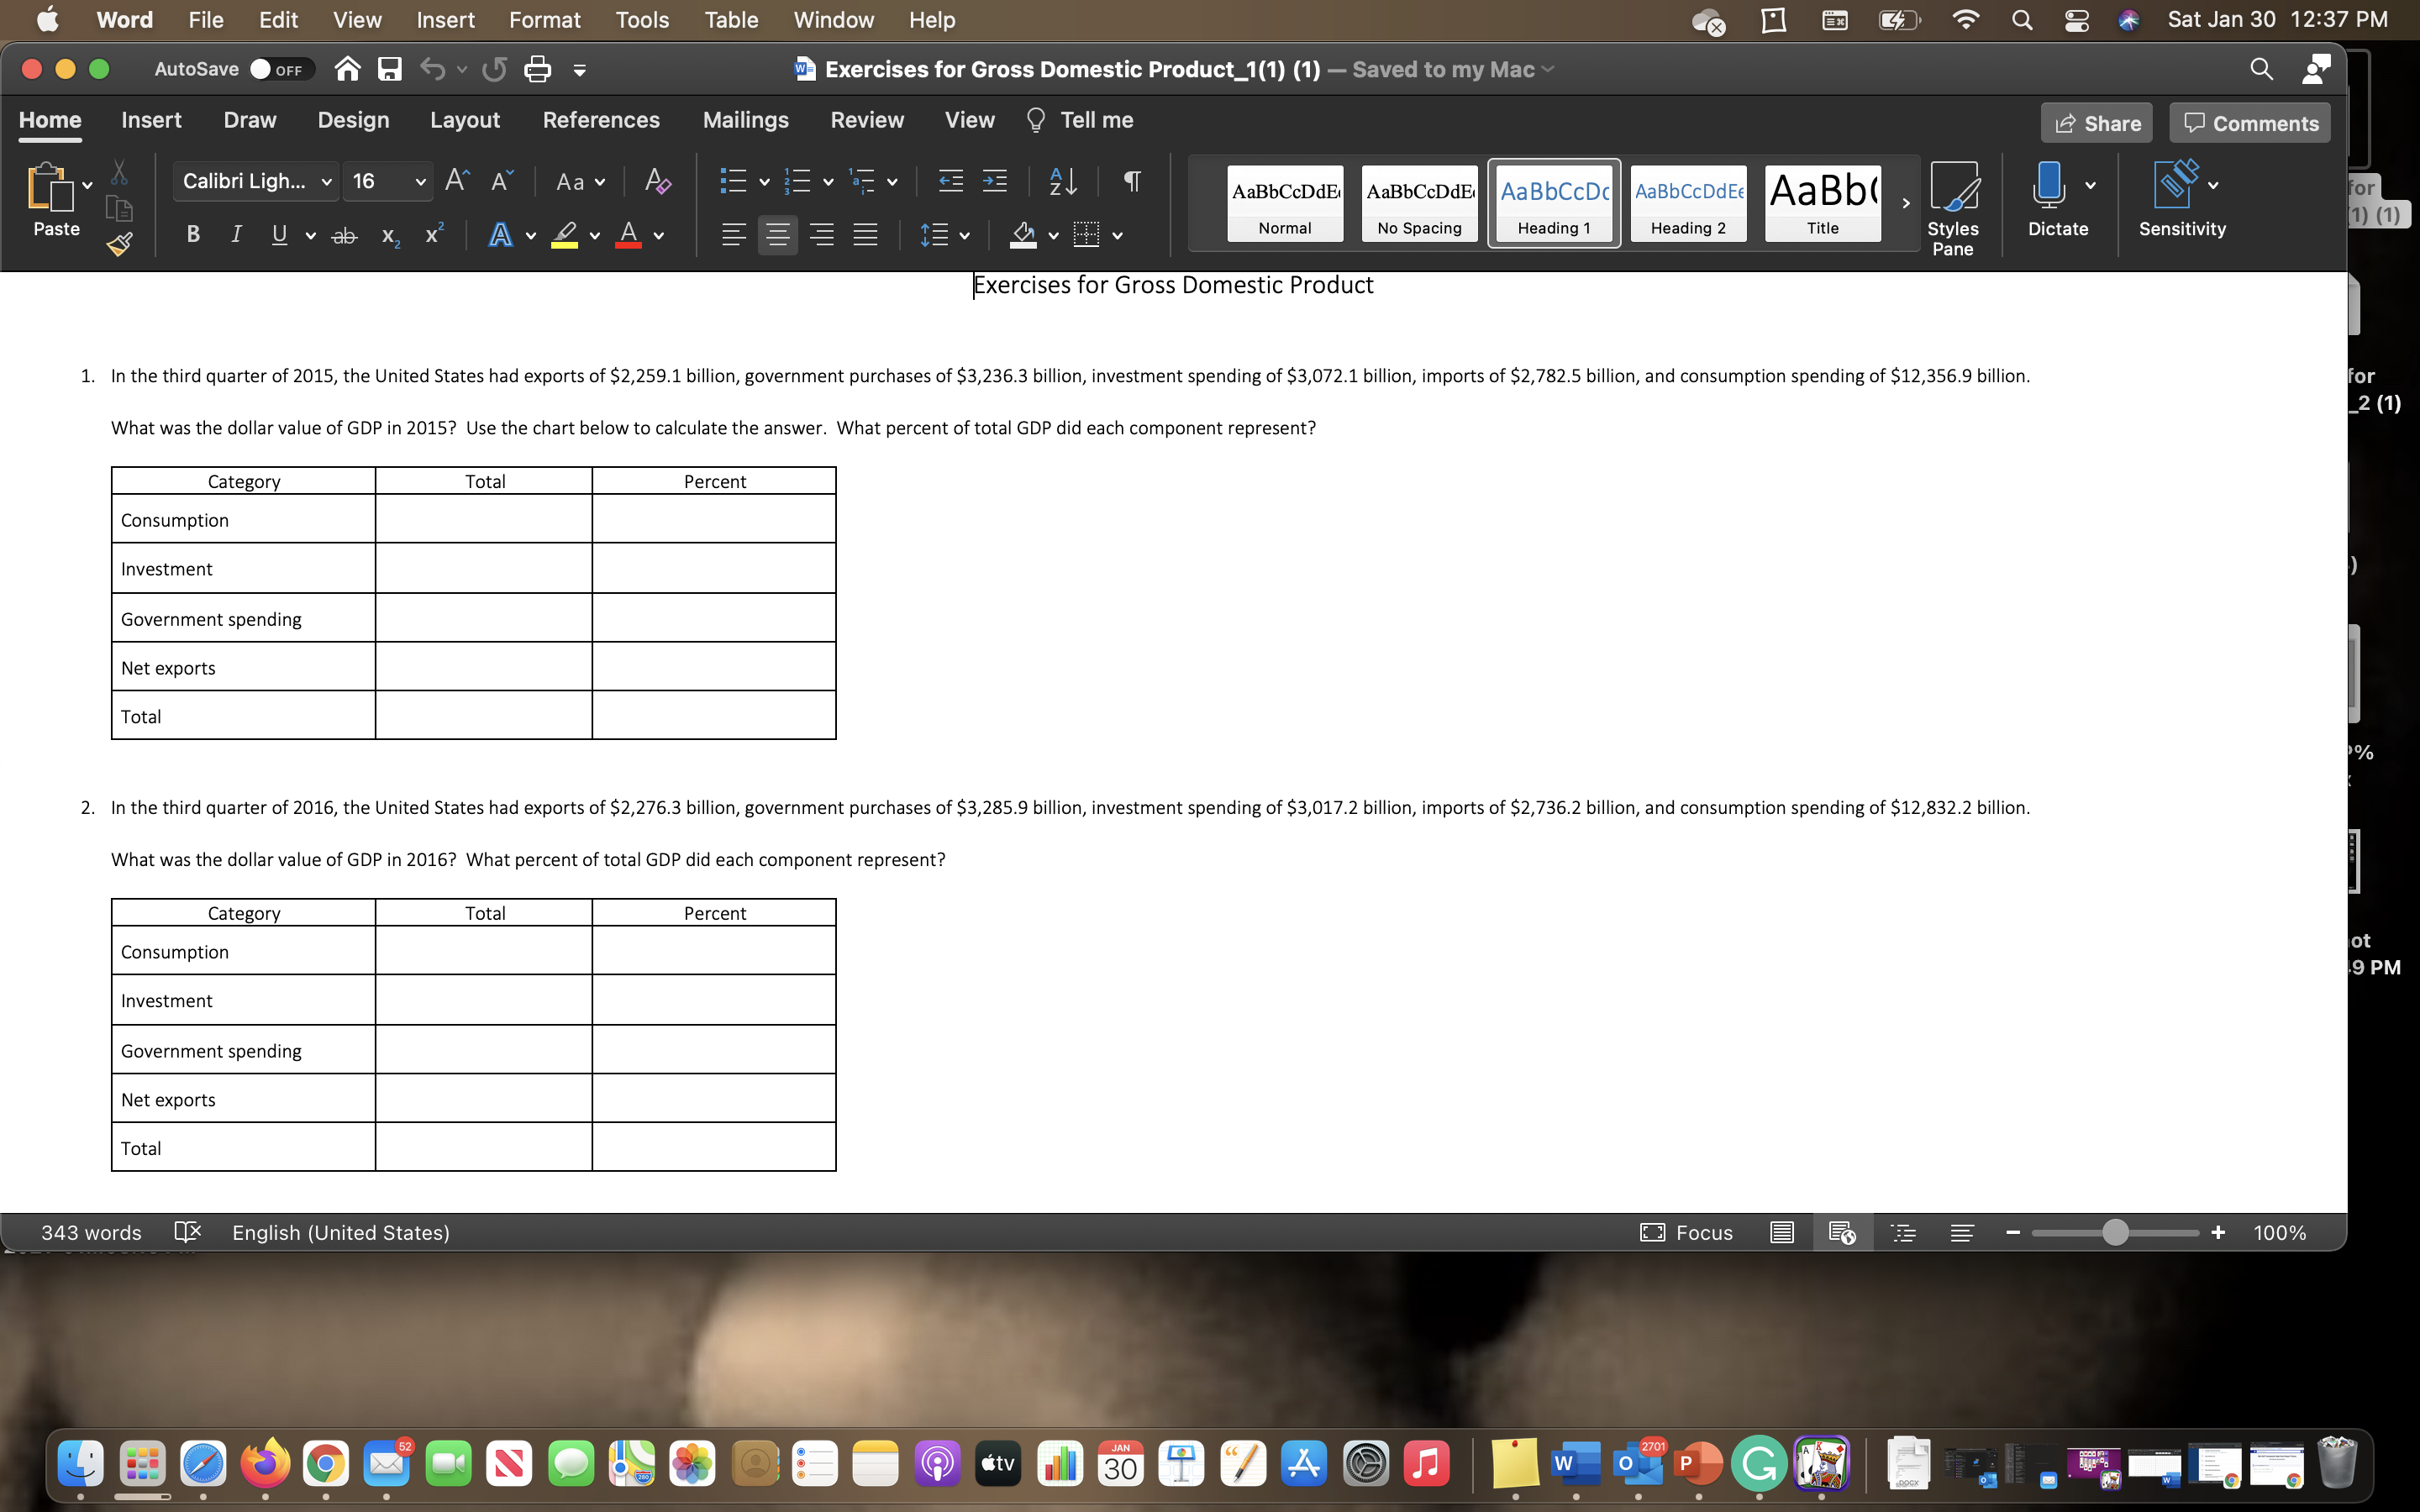
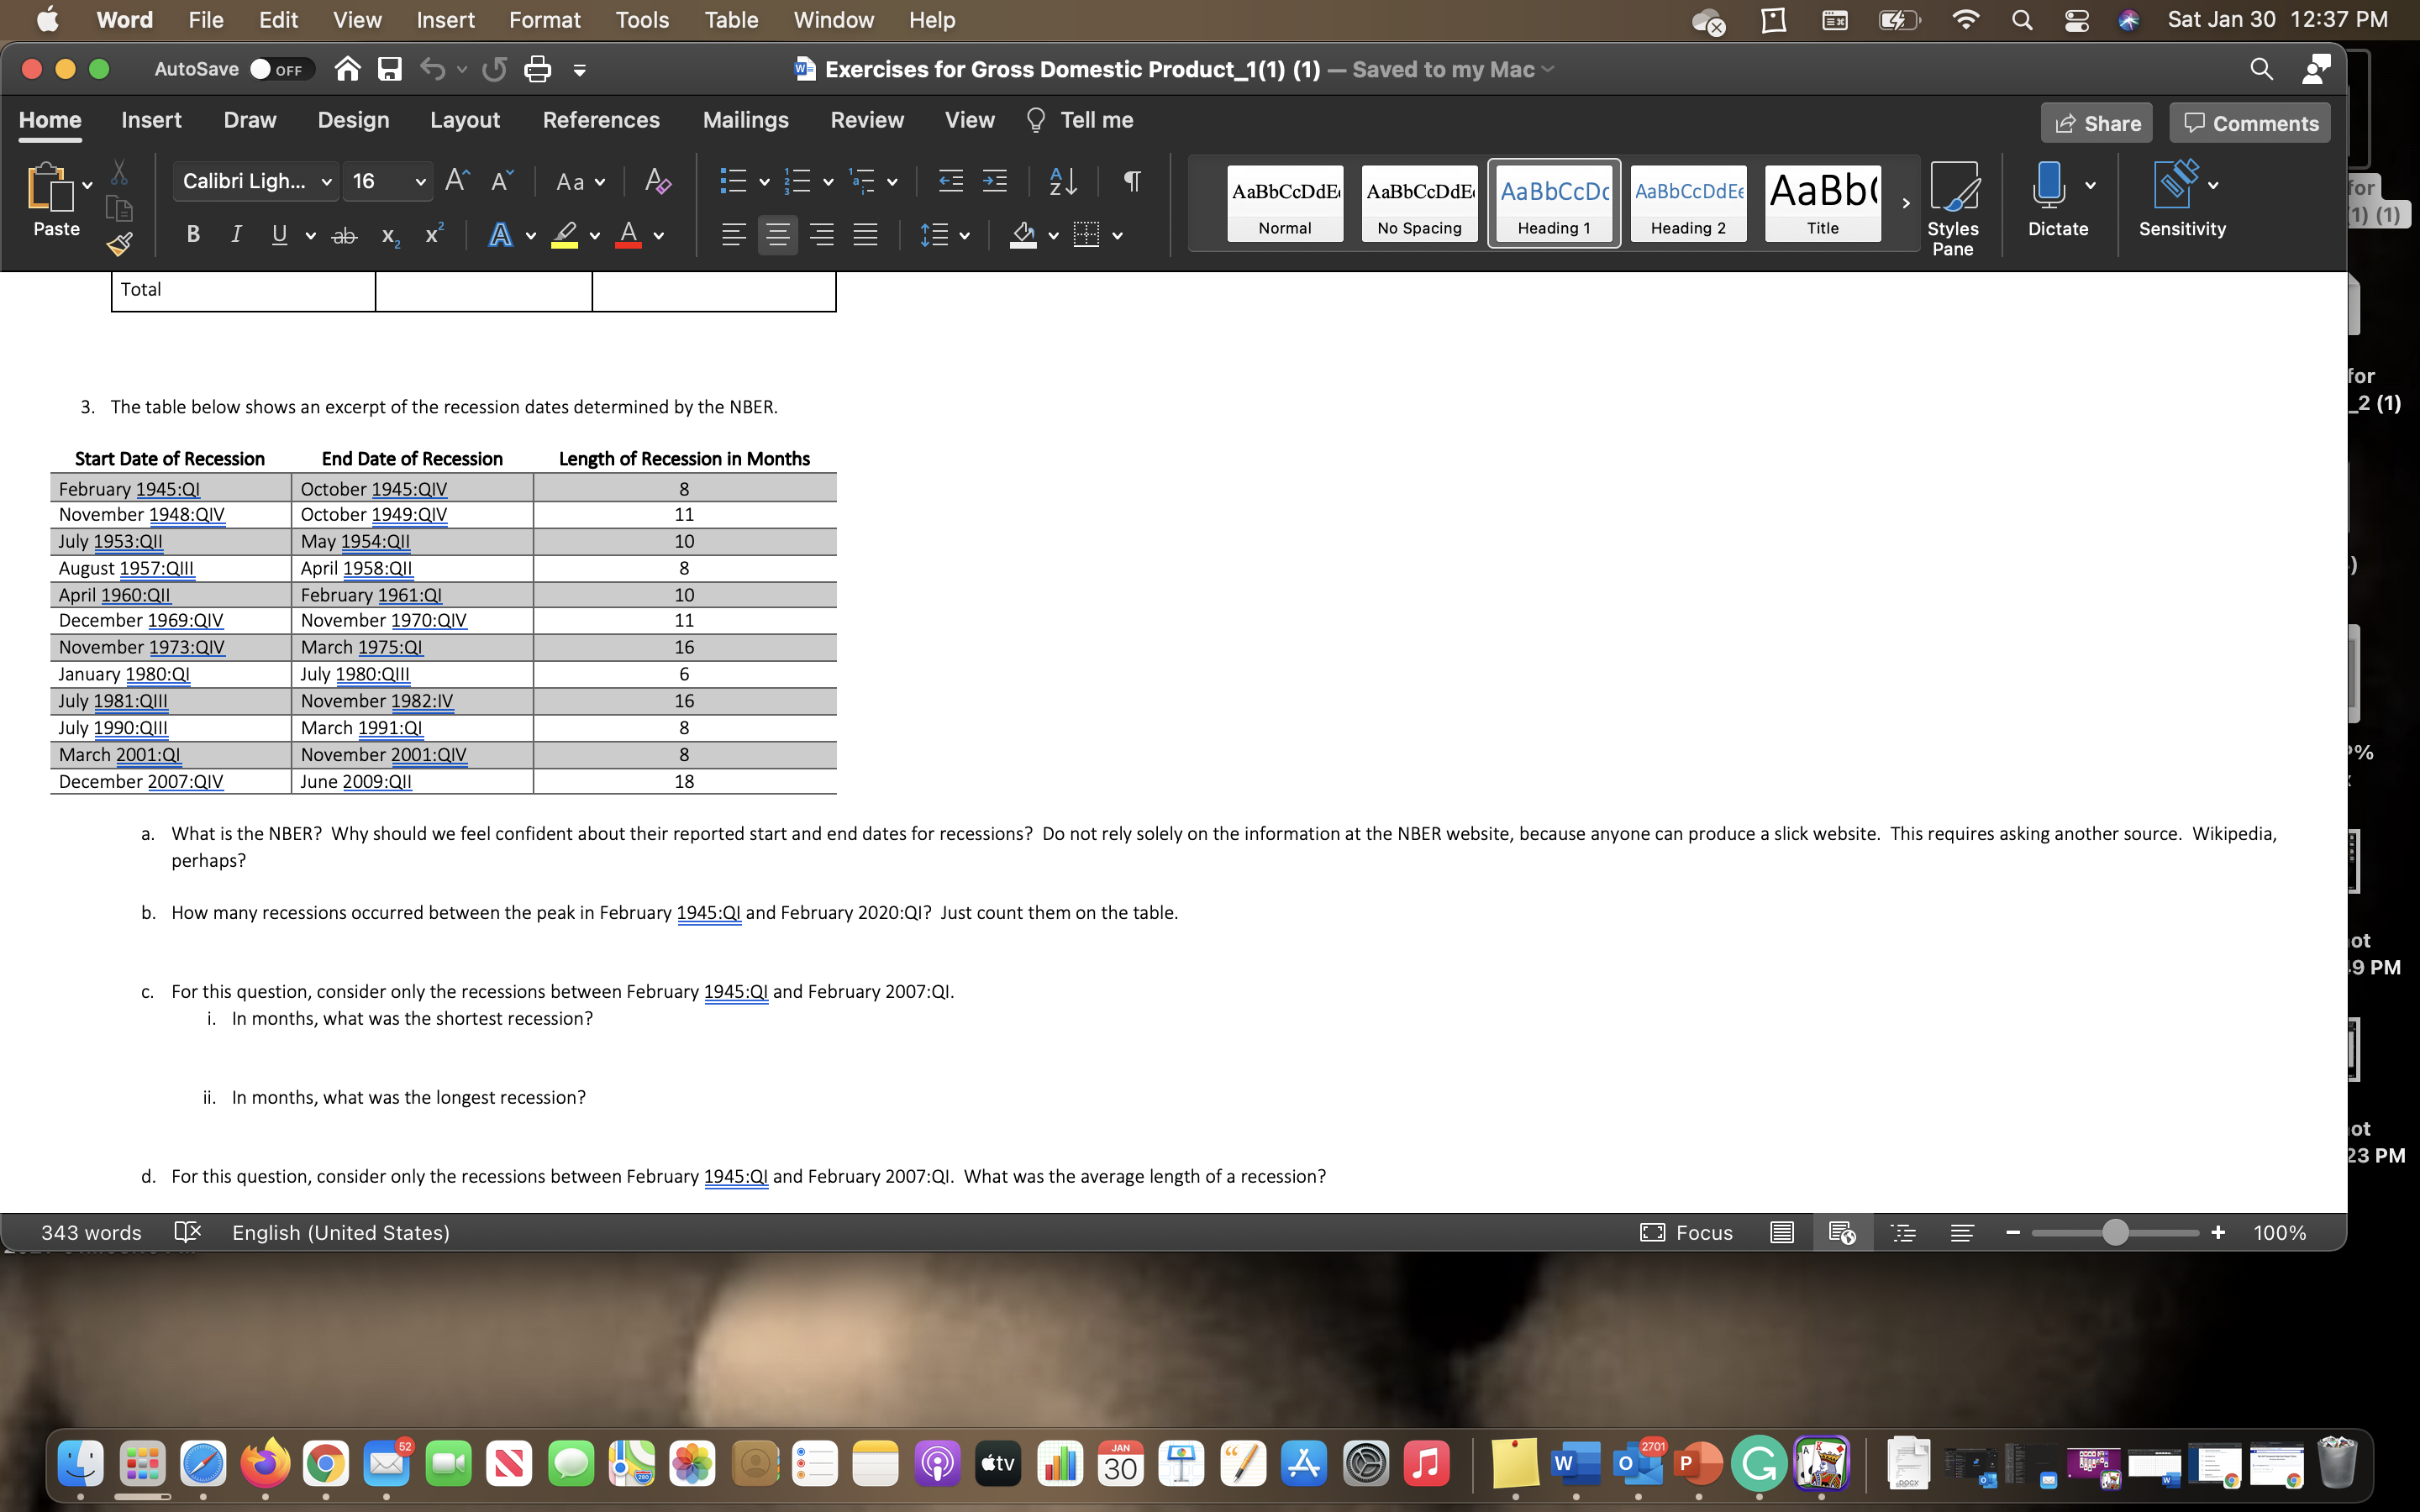

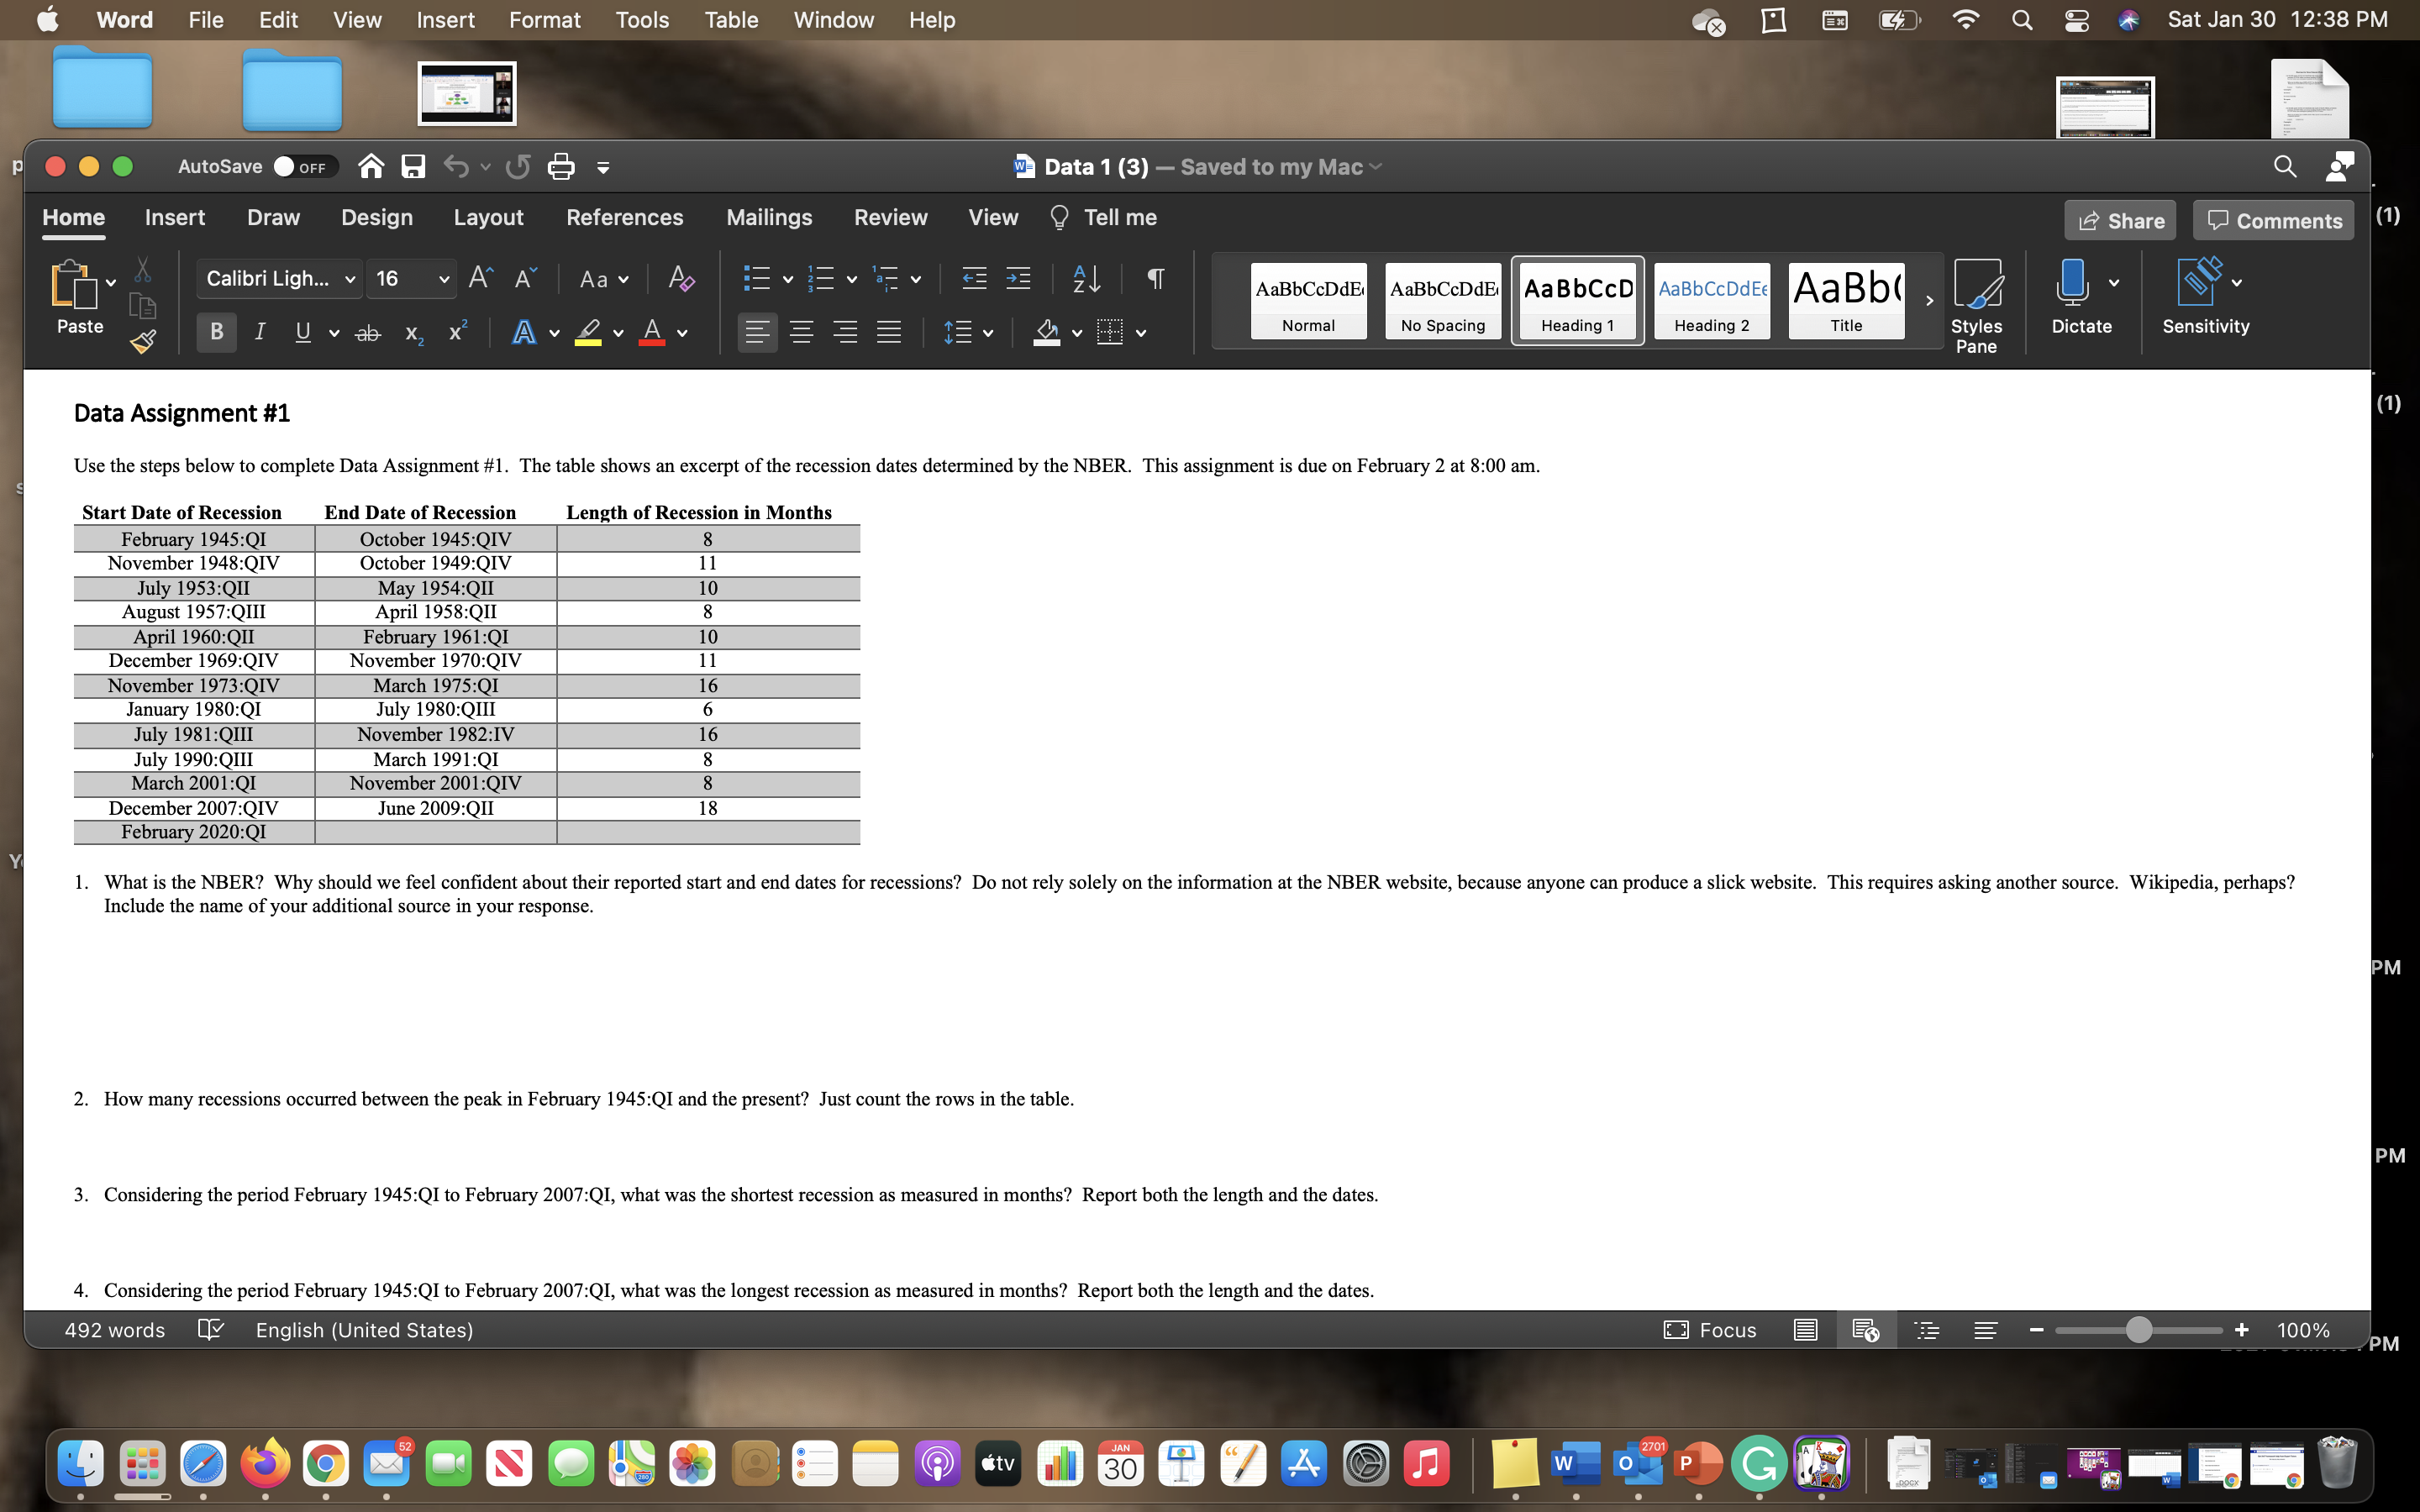
File Edit View Insert Format Tools Table Window Help SatJan3012137PM Q AutoSave . r' f} E Q : Ea Exercises for Gross Domestic Product_1(1) (1) - Home Insert Draw Design Layout References Mailings Review View '7 Tell me Share '17 Comments Liv Callbrlnghu. v , . . ABBbCCDdE' AaBb( > i Zi V paste B U V + i , Headingz Title Styles Dictate Sensitivity , 7 Pane xercises for Gross Domestic Product 1. In the third quarter of 2015, the United States had exports of 52259.1 billion, government purchases of 33,2363 billion, investment spending of 53,0711 billion, imports of 52,7825 billion, and consumption spending of 512.3563 billion. what was the dollar value of GDP in 2015? Use the chart below to calculate the answer. What percent of total GDP did each component represent? Category Total Percent Consumption Investment Government spending Net exports Total 2. in the third quarter of 2015, the United States had expom of$2,276.3 billion, government purchases of$3,285.9 billion, investment spending of$3,017.2 billion, imports of$2,736.2 billion, and consumption spending of 3123321 billion. What was the dollarvalue of GDP in 2016? What percent of total GDP did each component represent? Category Total Percent Consumption Investment Government spending Net expom Total 343 WOIdS English (United States) Cl Focus Word File Edit View Insert Format Tools Table Window Help Sat Jan 30 12:37 PM AutoSave O OFF wa Exercises for Gross Domestic Product_1(1) (1) - Saved to my Mac Home Insert Draw Design Layout References Mailings Review View Tell me Share Comments Calibri Ligh... V 16 A A Aa Ap a= v AaBbCcDdE AaBbCcDdE Aa BbCcD AaBbCcDdEE AaBb( For 1) (1) Paste BI Uvab X X A L Av Normal No Spacing Heading 1 Heading 2 Title Styles Dictate Sensitivity Pane Total for 3. The table below shows an excerpt of the recession dates determined by the NBER. 2 ( 1 ) Start Date of Recession End Date of Recession Length of Recession in Months February 1945:Q1 October 1945:QIV 8 November 1948:QIV October 1949:QIV 11 July 1953:Q11 May 1954:Q11 10 August 1957:Q11 April 1958:Q1 8 April 1960:Q11 February 1961:01 10 December 1969:QIV November 1970:01 11 November 1973:QIV March 1975:Q1 16 January 1980:Q July 1980:Q111 6 July 1981:Q111 November 1982:IV 16 July 1990:Q111 March 1991:01 8 March 2001:Q November 2001:QIV 8 December 2007:QIV June 2009:Q11 18 What is the NBER? Why should we feel confident about their reported start and end dates for recessions? Do not rely solely on the information at the NBER website, because anyone can produce a slick website. This requires asking another source. Wikipedia, perhaps b. How many recessions occurred between the peak in February 1945:QI and February 2020:Q1? Just count them on the table. ot 19 PM c. For this question, consider only the recessions between February 1945:Q1 and February 2007:Q1. i. In months, what was the shortest recession? ii. In months, what was the longest recession? ot 23 PM d. For this question, consider only the recessions between February 1945:QI and February 2007:Q1. What was the average length of a recession? 343 words English (United States) Focus E E + 100% tv 30 w OP'1 Word File Edit View Insert Format Tools Table Window Help a SatJan3012138PM . Autosave . f} E Q : v3 Exercises for Gross Domestic Product_2 (1) Q 0' Home Insert Draw Design Layout References Mailings Review View '7 Tell me vj' Share Ci Comments 1) (1) . . , ii. L\" Camb\"'\"\"\"~- V AaBchDd AaBchD AaBchDd AmdeM Aaebcwae ) i J I V V Paste . 5 '7 ,. x ' Emphas He n91 Normal Strong su tle Styles Dictate Sensitivity Pane il'hinking About Gross Domestic Product Answer these questions using the context in the question. 1. Ben Bernanke, former chairperson of the Federal Reserve Board of Governors, finds mowing the lawn to be relaxing and whenever possible, he mows his own lawn. During the Great Recession, however, Bernanke decided to hire a lawn service. Did GDP change as a result of Bernanke's decision? Did the amount of output produced in the economy change as a result of Bernanke's decision? 2. in the spring of 2017, flooding ravaged the Kansas City area causing widespread damage. What do you think happened to GDP in the area over the next few months? Do you think that the families living in the area felt that they were better off or worse off after the floods? 3. As the US developed in the early 18005, production moved from household production to market-based production. At the same time, the population growth rate increased. IfGDP is growing at 10% and the population is growing at 15%, do you think that families perceived themselves to be "better off"? What measure would you use to answer the question? 4. Assume that prices are rising at 10% per year and physical output is not growing. What will happen to GDP? 5. What do you think has happened to time available for leisure over the last 20 years? How is this recognized in GDP? 6. What do you think has happened to the distribution of income over the last 20 years? How is this recognized in GDP? What do you think happens to GDP when there is a major oil spill, for example, the pipeline explosion in Alabama in November 2016? Do you think that Alabama residents felt better off after this disaster? Word File Edit t View Insert Format Tools Table Window Help Q 8 Sat Jan 30 12:38 PM AutoSave O OFF ~ 4 6 6 6 7 Exercises for Gross Domestic Product_2 (1) - Saved to my Mac for Home Insert Draw Design Layout References Mailings Review View Tell me Share Comments (1) (1) Cambria (H... v 16 AA Aav AL AaBbCcDd AaBbCcD AaBbCcDd AaBbCcDc AaBbCcDdEE Paste BI UV X2 |ALVAv Emphasis Heading 1 Normal Strong Subtitle Styles Dictate Sensitivity Pane or 6. What do you think has happened to the distribution of income over the last 20 years? How is this recognized in GDP? 2 (1) 7. What do you think happens to GDP when there is a major oil spill, for example, the pipeline explosion in Alabama in November 2016? Do you think that Alabama residents felt better off after this disaster? For the remaining questions, assume that you are considering 2018 GDP. Recall that GDP is the total market value of all final goods and services produced within an economy in a year. Which of these events would have been included in US GDP for 2018? This is preparation for quiz questions. 1. My friends Sarah and Nick Blue work at a St. Louis restaurant as the pastry and executive chefs, respectively. On September 6, 2018, they purchased $500 worth of groceries in preparation for a wedding anniversary party at their home with family and friends. Are the groceries included in GDP? 2. On February 24, 2018, Joe Buck purchased an original painting by a Dutch artist in Amsterdam. Please note that the painting is so new that the paint is still damp. Is the painting included in GDP? ot Would it have made a difference if the artist was working at Washington University in St. Louis when he painted the piece? 9 PM 3. Early on the morning of July 31, 2018, William H. Gates, Sr.-Bill Gates' father-purchased 1000 shares of Apple stock. Are the shares included in GDP? 4. In February 2018, Janet Yellen, former Chairperson of the Federal Reserve Board of Governors, purchased an historic home in Alexandria, Virginia near Mount Vernon, George Washington's home. Is the purchase included in GDP? ot 23 PM 5 . During May 2018, Drake Painting and Design Company painted the rooms on the first floor of our house. Is the painting included in GDP? 6. Promptly at 12:01 am on January 1, 2018, my daughter purchased a new Ford Mustang convertible from a Lou Fusz dealership in St. Louis. Is the car in GDP? Focus + 100% ot 670 words English (United States E 34 PM 9 "tv 30 4 W PWord File Edit t View Insert Format Tools Table Window Help Sat Jan 30 12:38 PM AutoSave O OFF ~ 4 6 6 6 7 Data 1 (3) - Saved to my Mac Home Insert Draw Design Layout References Mailings Review View Tell me Share Comments (1) Calibri Ligh... 16 A A Aav AaBbCcDdE AaBbCcDdE AaBbCCD AaBbCcDdEE AaBb( Paste BIUva X X A v . Normal No Spacing Heading 1 Heading 2 Title Styles Dictate Sensitivity Pane Data Assignment #1 (1) Use the steps below to complete Data Assignment #1. The table shows an excerpt of the recession dates determined by the NBER. This assignment is due on February 2 at 8:00 am. Start Date of Recession End Date of Recession Length of Recession in Months February 1945:Q1 October 1945:QIV 8 November 1948:QIV October 1949:QIV July 1953:QII May 1954:QII 10 August 1957:QIII April 1958:Q1 8 April 1960:Q1 February 1961:Q1 10 December 1969:QIV November 1970:QIV 11 November 1973:QIV March 1975:Q1 16 January 1980:Q1 July 1980:QIII 6 July 1981:QIII November 1982:IV 16 July 1990:QIII March 1991:Q1 8 March 2001:Q1 November 2001:QIV 8 December 2007:QIV June 2009:QII 18 February 2020:Q1 1. What is the NBER? Why should we feel confident about their reported start and end dates for recessions? Do not rely solely on the information at the NBER website, because anyone can produce a slick website. This requires asking another source. Wikipedia, perhaps? Include the name of your additional source in your response. PM 2. How many recessions occurred between the peak in February 1945:QI and the present? Just count the rows in the table. PM 3. Considering the period February 1945:QI to February 2007:QI, what was the shortest recession as measured in months? Report both the length and the dates. Considering the period February 1945:QI to February 2007:QI, what was the longest recession as measured in months? Report both the length and the dates. 492 words English (United States Focus E - + 100% PM 9 tv 30 4 W P'1 Word File Edit View Insert Format Tools Table Window Help SatJan3012138PM . Autosave . , 6' E .3. 1:: Data1 (3) Home insert Draw Design Layout References Mailings Review View 'L. Tell me 13 Share Cl Comments L V ' ' AaBchDdEE ' V Paste , Heading 2 Styles Dictate Sensitivity 4 Pane 3. Considering the period February 1945121 to February 2007121, what was the shortest recession as measured in months? Report both the length and the dates. . Considering the period February 1945121 to February 2007121, what was the longest recession as measured in months? Report both the length and the dates. . Considering the period February 1945121 to February 2007121, what was the average length ofa recession? You may use either a mean or median to answer this question lnclnde at least one digit aer the decimal place in your response. (Hint: To calculate a mean, sum the lengths ofthe recessions and divide by the number of recessions.) . In months, how long was the Great Recession, that is, the recession beginning in December 2007? 1 Look at the graph attached. This graph shows the percent change in real GDP from 1947 to the present. What do you think that the gray bars represent? (Hint: Compare the bars to the dates in the table above.) 1 Using the period 1947 to the present, how many recessions do you believe had a larger one quarter drop in RGDP than the Great Recession? If you are not content to make an estimate from the graph you can visit FREDi FRED stands for Federal Reserve Economic Data. The site which contains more than 780,000 data series is maintained by the Federal Reserve Bank of St. Louis. When you arrive at FRED, page down until you see Real Gross Domestic Product under the At I Ghnce tab. Click an the title afthe series. Take a deep breath and the graph will appear. If you place your cursor on the graph, you can see the percent changes at any point. . Which recession exhibited the largest percent decrease? 10, A brief change of reference, when did the longest expansion oocur'! 492wurds l]? Enghsltwm Stetcst ElFucus I E; + 100 i"? Iw Git\
Step by Step Solution
There are 3 Steps involved in it

Get step-by-step solutions from verified subject matter experts