

Question: can you please include tables and calculations Background It is often said that it's easier to drop the price than to raise the price. H&H,
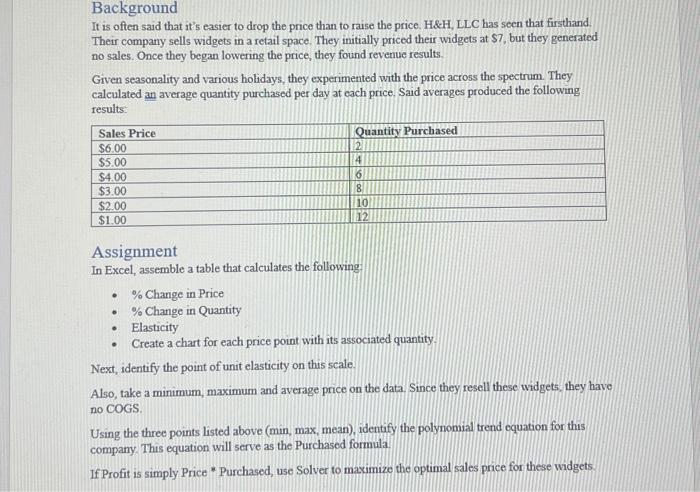
Background It is often said that it's easier to drop the price than to raise the price. H\&H, LLC has seen that firsthand. Their company sells widgets in a retail space. They initially priced their widgets at $7, but they generated no sales. Once they began lowering the price, they found revenue results. Given seasonality and various holidays, they experimented with the price across the spectrum. They calculated an average quantity purchased per day at cach price. Said averages produced the following results: Assignment In Excel, assemble a table that calculates the following - % Change in Price - \% Change in Quantity - Elasticity - Create a chart for each price point with its associated quantity. Next, identify the point of unit elasticity on this scale. Also, take a minimum, maximum and average price on the data. Since they resell these widgets, they have no COGS. Using the three points listed above ( min,max, mean), identify the polynomial trend equation for this company. This equation will serve as the Purchased formula. If Profit is simply Price * Purchased, use Solver to maximizo the optimal sales price for these widgets. Background It is often said that it's easier to drop the price than to raise the price. H\&H, LLC has seen that firsthand. Their company sells widgets in a retail space. They initially priced their widgets at $7, but they generated no sales. Once they began lowering the price, they found revenue results. Given seasonality and various holidays, they experimented with the price across the spectrum. They calculated an average quantity purchased per day at cach price. Said averages produced the following results: Assignment In Excel, assemble a table that calculates the following - % Change in Price - \% Change in Quantity - Elasticity - Create a chart for each price point with its associated quantity. Next, identify the point of unit elasticity on this scale. Also, take a minimum, maximum and average price on the data. Since they resell these widgets, they have no COGS. Using the three points listed above ( min,max, mean), identify the polynomial trend equation for this company. This equation will serve as the Purchased formula. If Profit is simply Price * Purchased, use Solver to maximizo the optimal sales price for these widgets
Step by Step Solution
There are 3 Steps involved in it

Get step-by-step solutions from verified subject matter experts