

Question: Can you please interpret Q1.4. Run analyses for partial correlation to determine whether there is a linear relationship between VO2max and weight, whilst controlling for
Can you please interpret
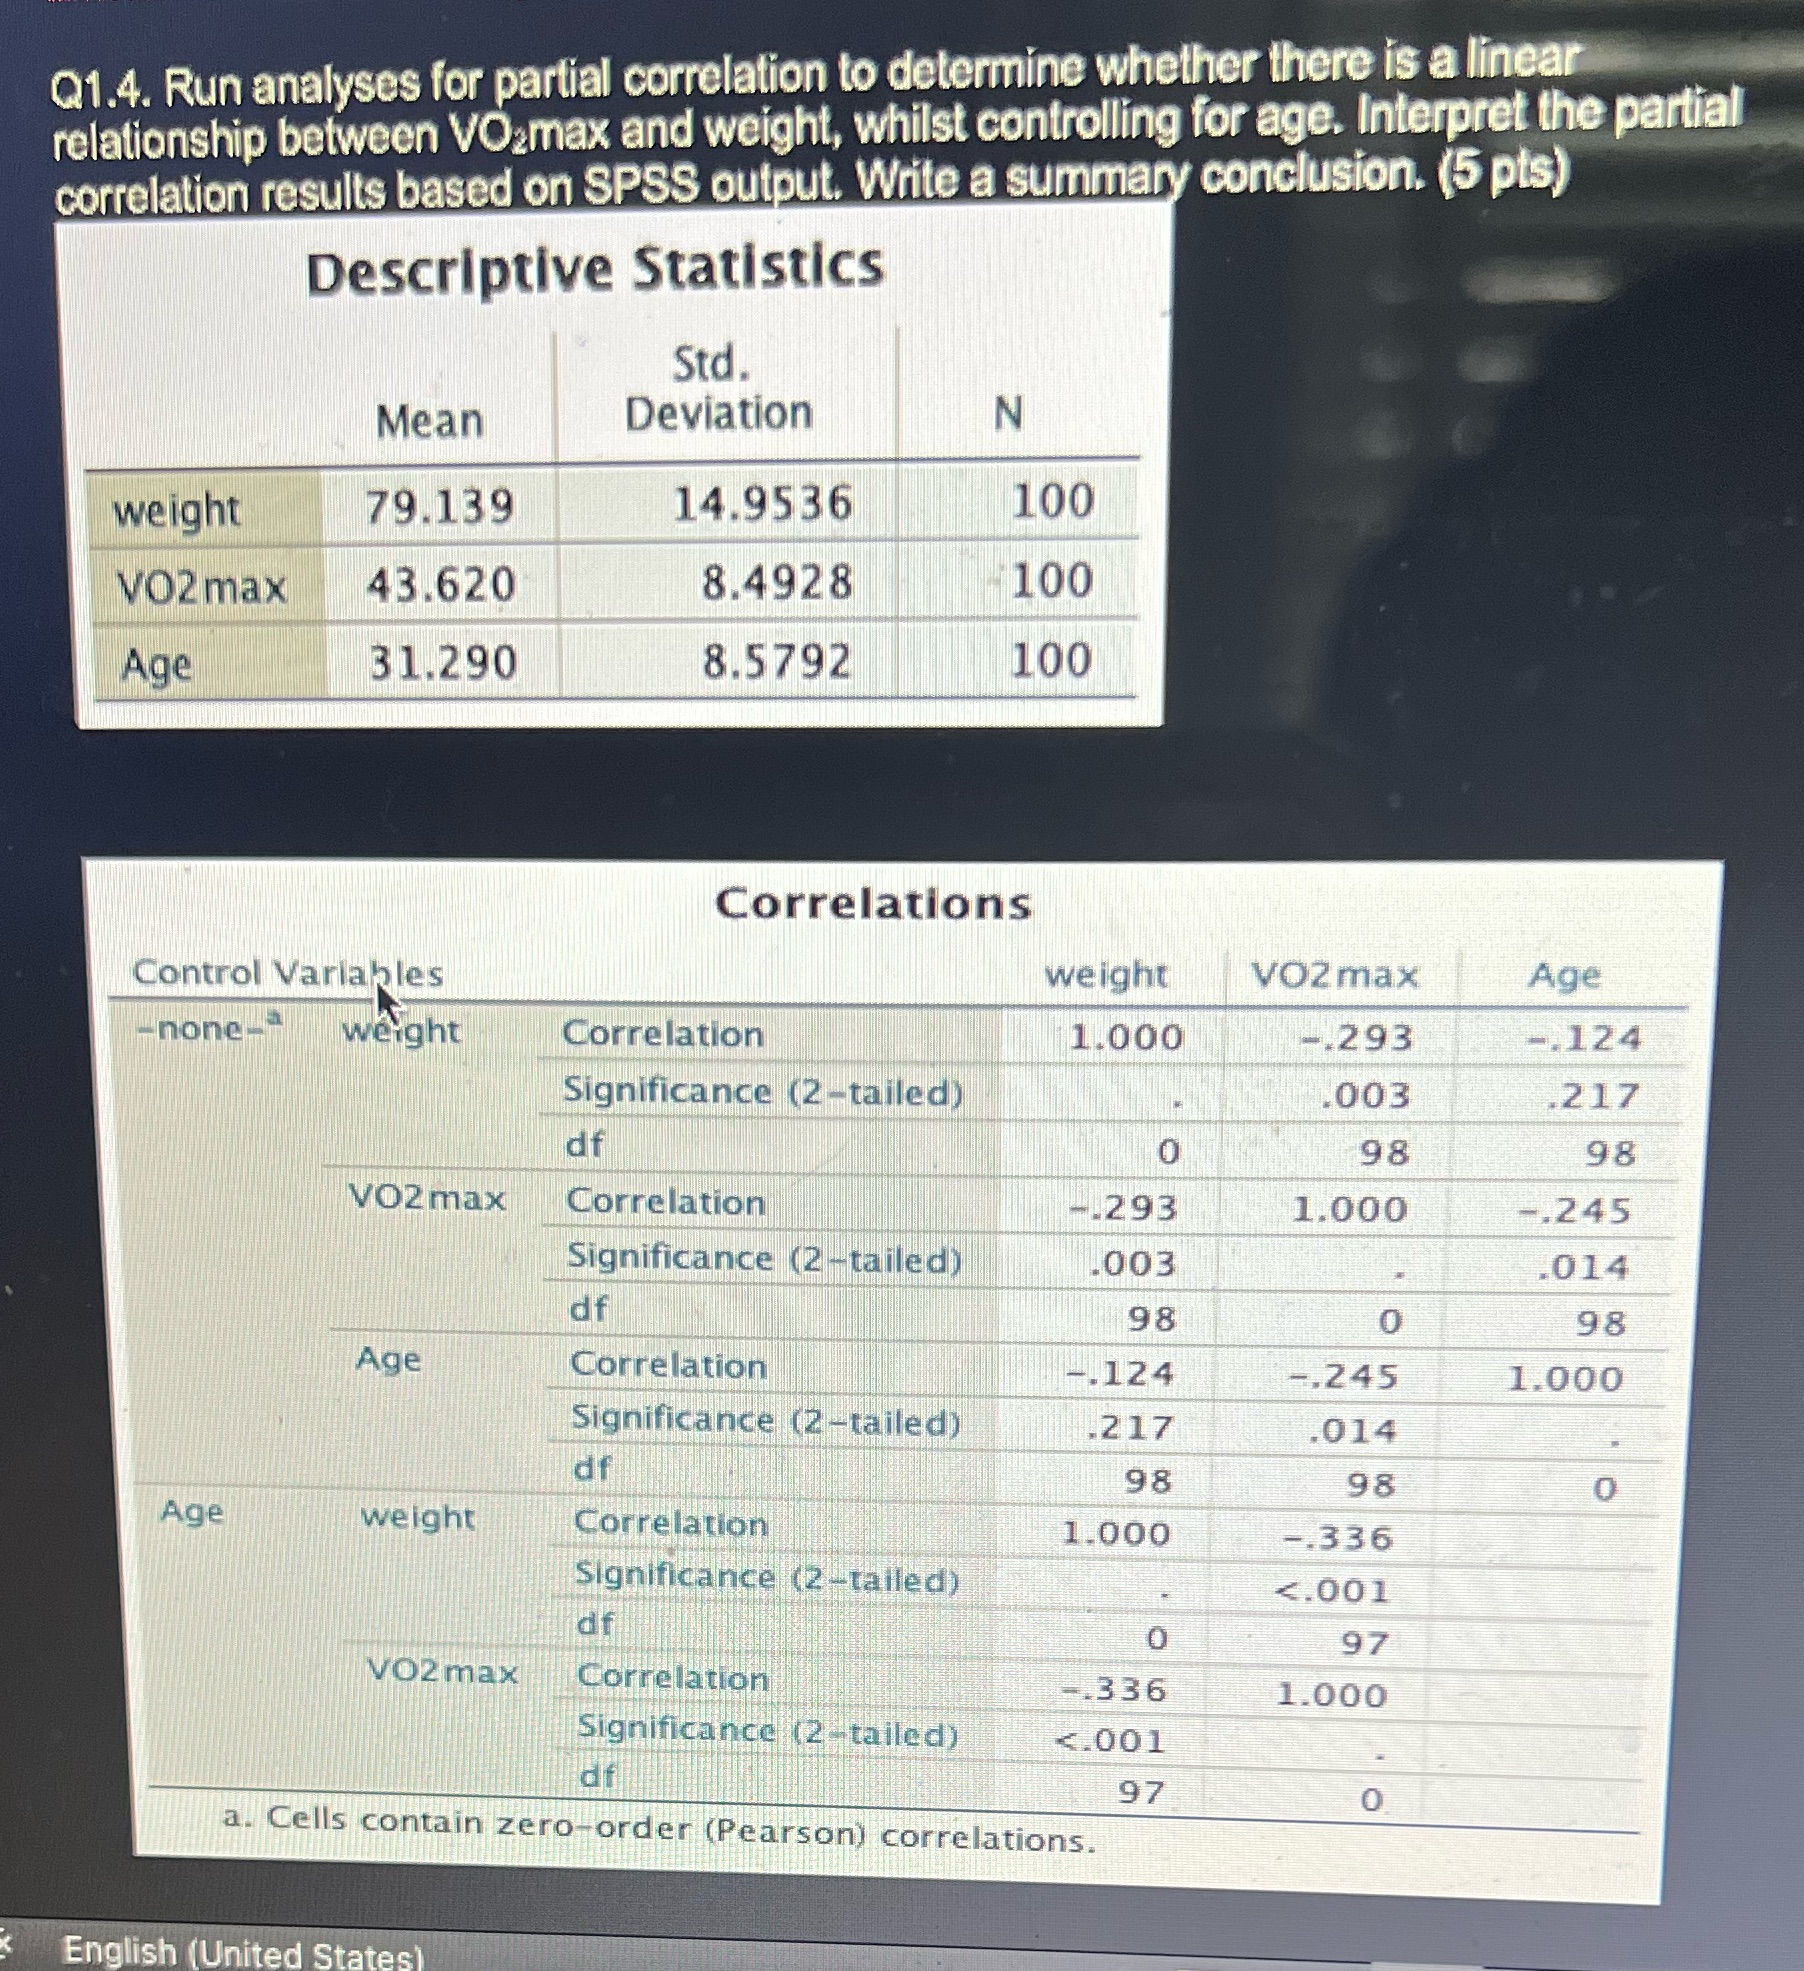
Q1.4. Run analyses for partial correlation to determine whether there is a linear relationship between VO2max and weight, whilst controlling for age. Interpret the partial correlation results based on SPSS output. Write a summary conclusion. (5 pts) Descriptive Statistics Std. Mean Deviation N weight 79.139 14.9536 100 VO2 max 43.620 8.4928 100 Age 31.290 8.5792 100 Correlations Control Variables weight VOZmax Age -none_ weight Correlation 1.000 -.293 -.124 Significance (2-tailed) .003 .217 df 98 98 VO2max Correlation -293 1.000 -.245 Significance (2-tailed) .003 014 98 O 98 Age Correlation -.124 -.245 1.000 Significance (2-tailed) .217 .014 df 98 98 Age weight Correlation 1.000 -.336 Significance (2-tailed) <.001 df vo2 max correlation significance a. cells contain zero-order correlations. english states>
Step by Step Solution
There are 3 Steps involved in it

Get step-by-step solutions from verified subject matter experts