

Question: Can you please show work? So I am able to see how it is done. Income Statements for Years Ending 9/29/139 /28/14 ($ millions) ($
 Can you please show work? So I am able to see how it is done.
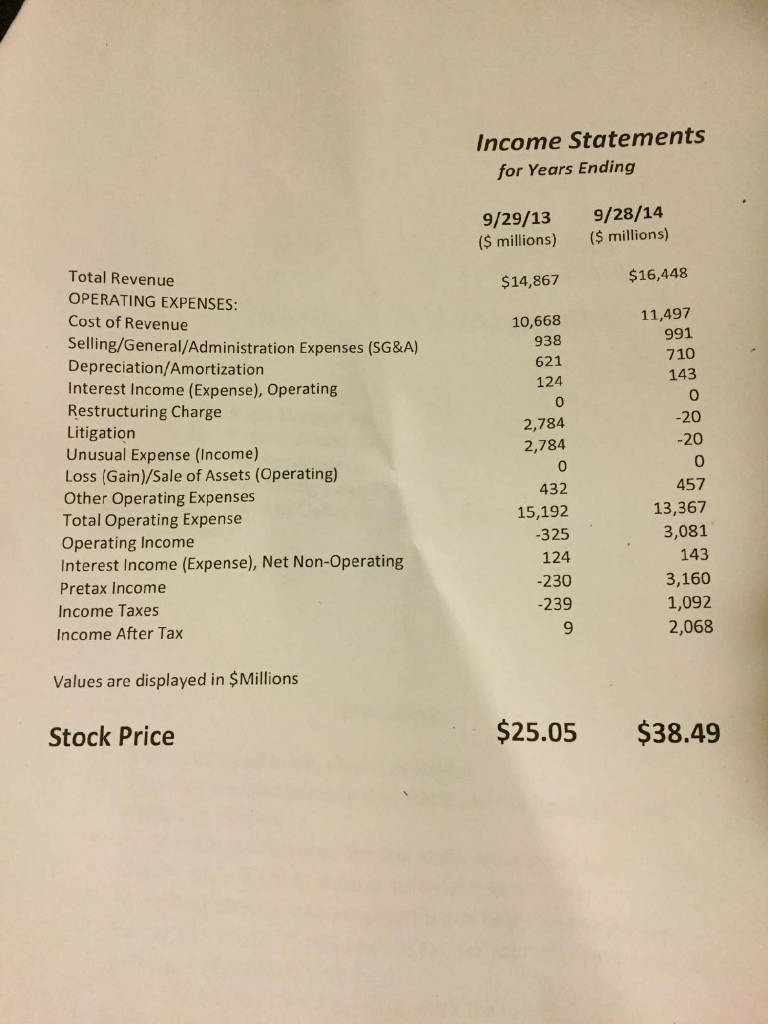
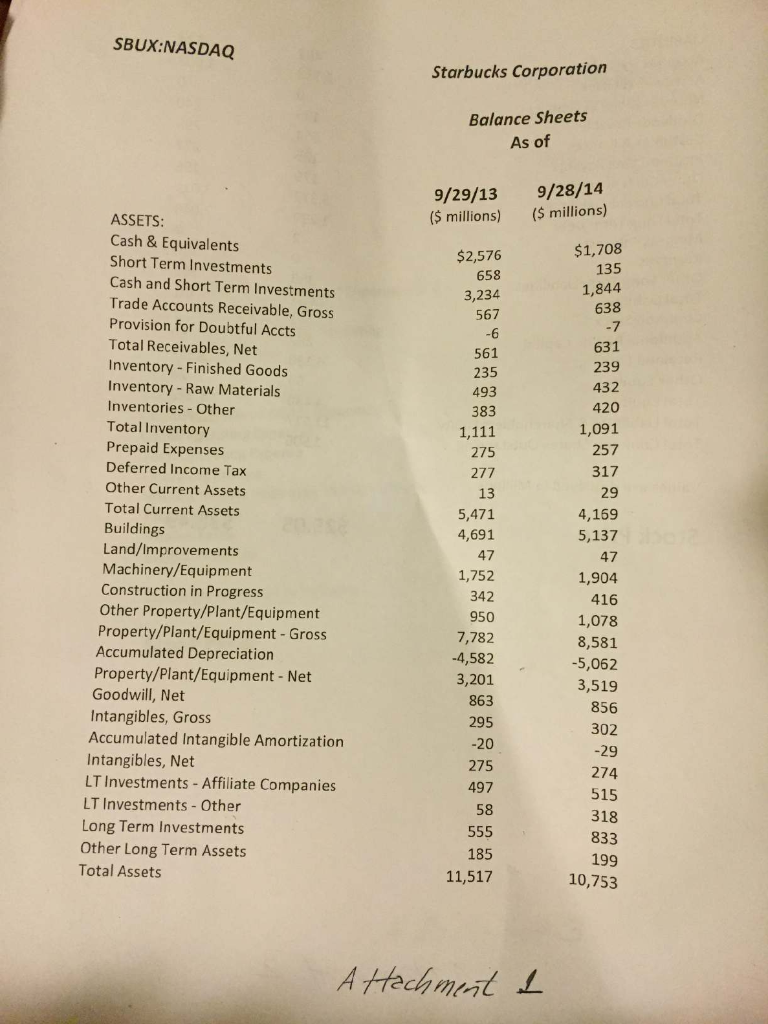
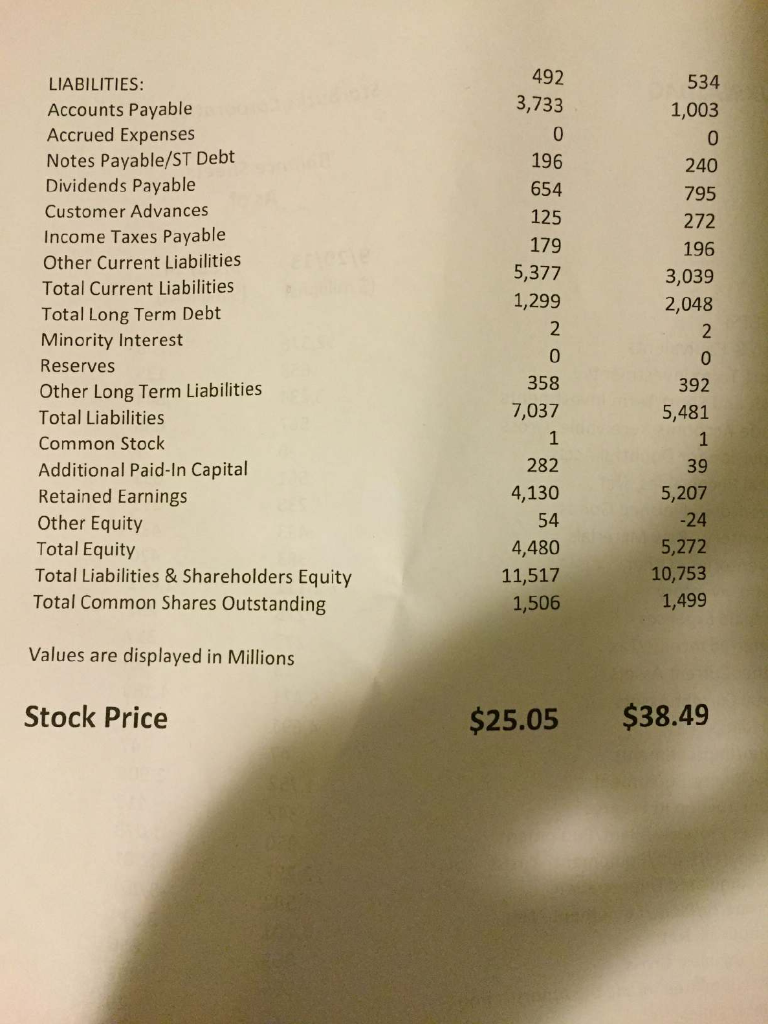
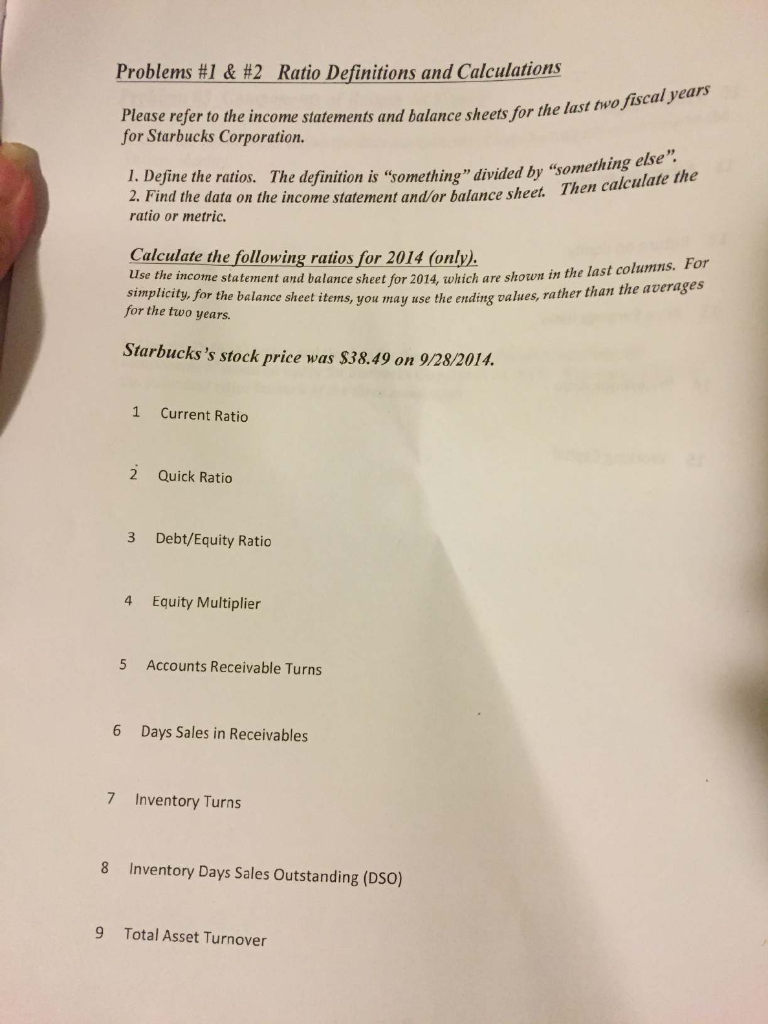
Income Statements for Years Ending 9/29/139 /28/14 ($ millions) ($ millions) $14,867 $16,448 11,497 10,668 938 621 991 710 143 124 0 0 -20 2,784 2,784 -20 Total Revenue OPERATING EXPENSES: Cost of Revenue Selling/General/Administration Expenses (SG&A) Depreciation/Amortization Interest Income (Expense), Operating Restructuring Charge Litigation Unusual Expense (Income) Loss (Gain)/Sale of Assets (Operating) Other Operating Expenses Total Operating Expense Operating Income Interest Income (Expense), Net Non-Operating Pretax Income Income Taxes Income After Tax 432 15,192 -325 457 13,367 3,081 124 143 -230 -239 3,160 1,092 2,068 9 Values are displayed in $Millions Stock Price $25.05 $38.49 SBUX:NASDAQ Starbucks Corporation Balance Sheets As of 9/29/13 ($ millions) 9/28/14 ($ millions) $1,708 $2,576 658 3,234 567 561 235 493 383 1,111 135 1,844 638 -7 631 239 432 420 1,091 257 317 275 277 13 29 5,471 4,691 ASSETS: Cash & Equivalents Short Term Investments Cash and Short Term Investments Trade Accounts Receivable, Gross Provision for Doubtful Accts Total Receivables, Net Inventory - Finished Goods Inventory - Raw Materials Inventories - Other Total Inventory Prepaid Expenses Deferred Income Tax Other Current Assets Total Current Assets Buildings Land/Improvements Machinery/Equipment Construction in Progress Other Property/Plant/Equipment Property/Plant/Equipment - Gross Accumulated Depreciation Property/Plant/Equipment - Net Goodwill, Net Intangibles, Gross Accumulated Intangible Amortization Intangibles, Net LT Investments - Affiliate Companies LT Investments - Other Long Term Investments Other Long Term Assets Total Assets 1,752 342 950 7,782 -4,582 3,201 863 295 -20 275 497 58 555 185 11,517 4,169 5,137 47 1,904 416 1,078 8,581 -5,062 3,519 856 302 -29 274 515 318 833 199 10,753 Attachment a 492 3,733 534 1,003 0 0 196 654 125 179 5,377 1,299 240 795 272 196 3,039 2,048 LIABILITIES: Accounts Payable Accrued Expenses Notes Payable/ST Debt Dividends Payable Customer Advances Income Taxes Payable Other Current Liabilities Total Current Liabilities Total Long Term Debt Minority Interest Reserves Other Long Term Liabilities Total Liabilities Common Stock Additional Paid-In Capital Retained Earnings Other Equity Total Equity Total Liabilities & Shareholders Equity Total Common Shares Outstanding 0 392 358 7,037 5,481 39 5,207 282 4,130 54 4,480 11,517 1,506 -24 5,272 10,753 1,499 Values are displayed in Millions Stock Price $25.05 $38.49 Problems #1 & #2 Ratio Definitions and Calculations Please refer to the income statements and balance sheets for the last for Starbucks Corporation. e sheets for the last two fiscal years ing" divided by "something else". 1. Define the ratios. The definition is "something" divided by "some 2. Find the data on the income statement and/or balance sheet. Then ratio or metric. Calculate the following ratios for 2014 (only). Use the income statement and balance sheet for 2014, which are shown in the last simplicity, for the balance sheet items, you may use the ending values, ram for the two years. for 2014, which are shown in the last columns. For you may use the ending values, rather than the averages Starbucks's stock price was $38.49 on 9/28/2014. 1 Current Ratio 2 Quick Ratio 3 Debt/Equity Ratio 4 Equity Multiplier 5 Accounts Receivable Turns 6 Days Sales in Receivables 7 Inventory Turns 8 Inventory Days Sales Outstanding (DSO) 9 Total Asset Turnover
Step by Step Solution
There are 3 Steps involved in it

Get step-by-step solutions from verified subject matter experts