

Question: can you please solve for 1) 2) and 3). i really need help The following table represents Canada's population in specific years over the last
can you please solve for 1) 2) and 3). i really need help
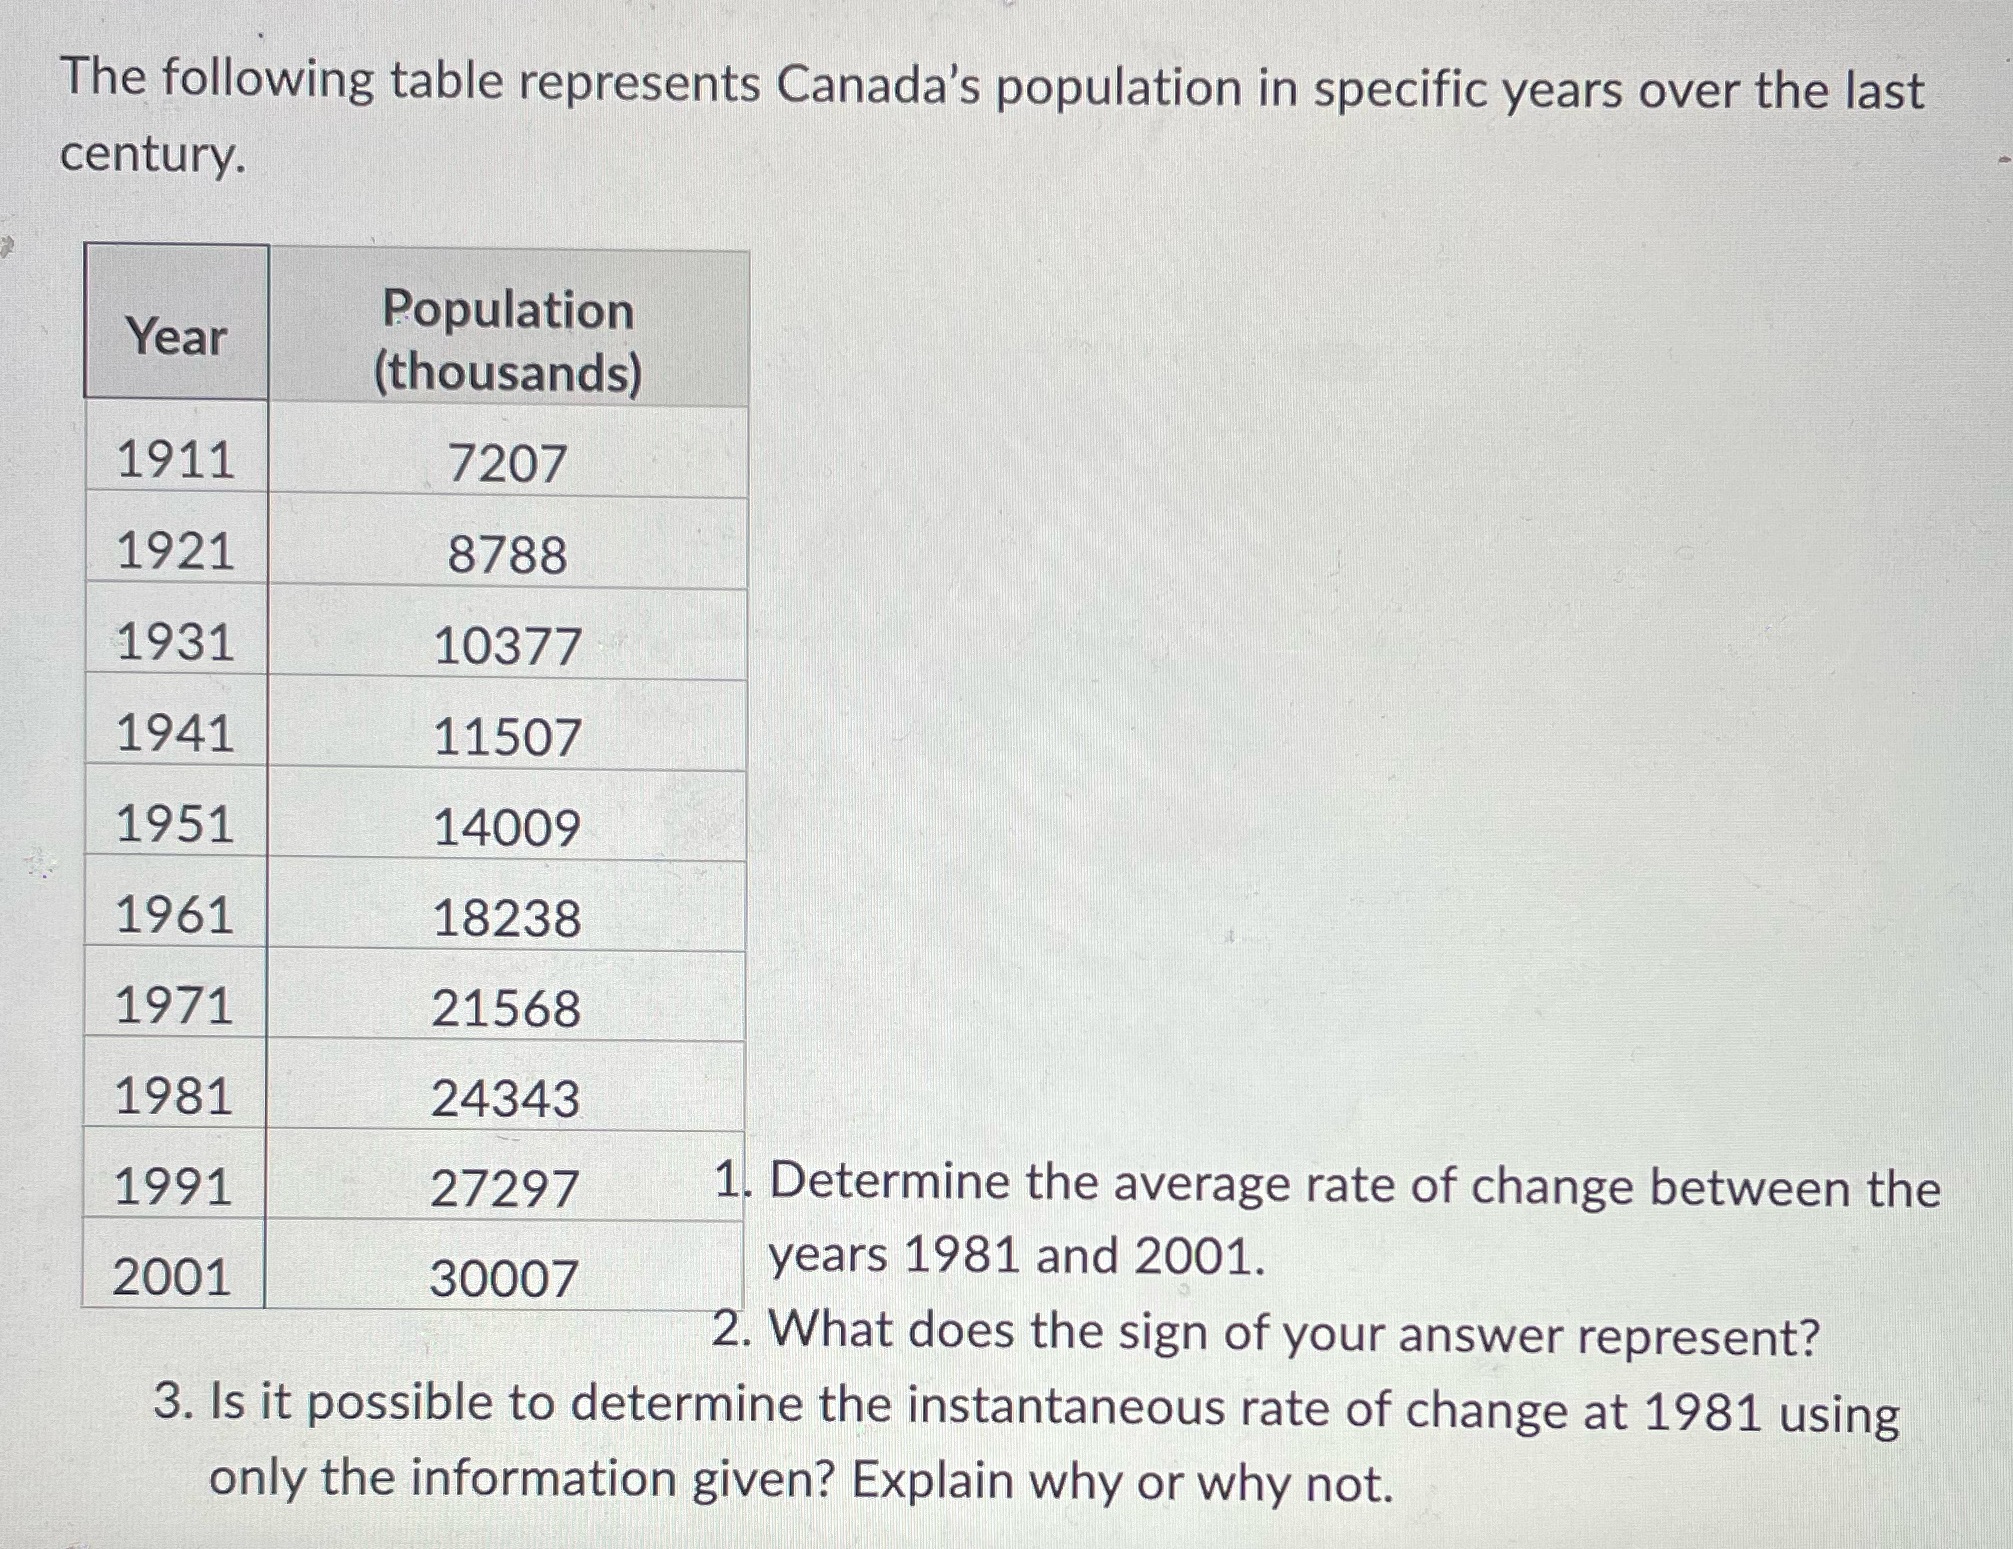
The following table represents Canada's population in specific years over the last century. Year Population (thousands) 1911 7207 1921 8788 1931 10377 1941 11507 1951 14009 1961 18238 1971 21568 1981 24343 1991 27297 1. Determine the average rate of change between the 2001 30007 years 1981 and 2001. 2. What does the sign of your answer represent? 3. Is it possible to determine the instantaneous rate of change at 1981 using only the information given? Explain why or why not
Step by Step Solution
There are 3 Steps involved in it
1 Expert Approved Answer
Step: 1 Unlock

Question Has Been Solved by an Expert!
Get step-by-step solutions from verified subject matter experts
Step: 2 Unlock
Step: 3 Unlock