

Question: can you pls help me graph this and answer the question Number of Number of Cans in Cans Sold Recycling Bin 60 55 87 80
can you pls help me graph this and answer the question
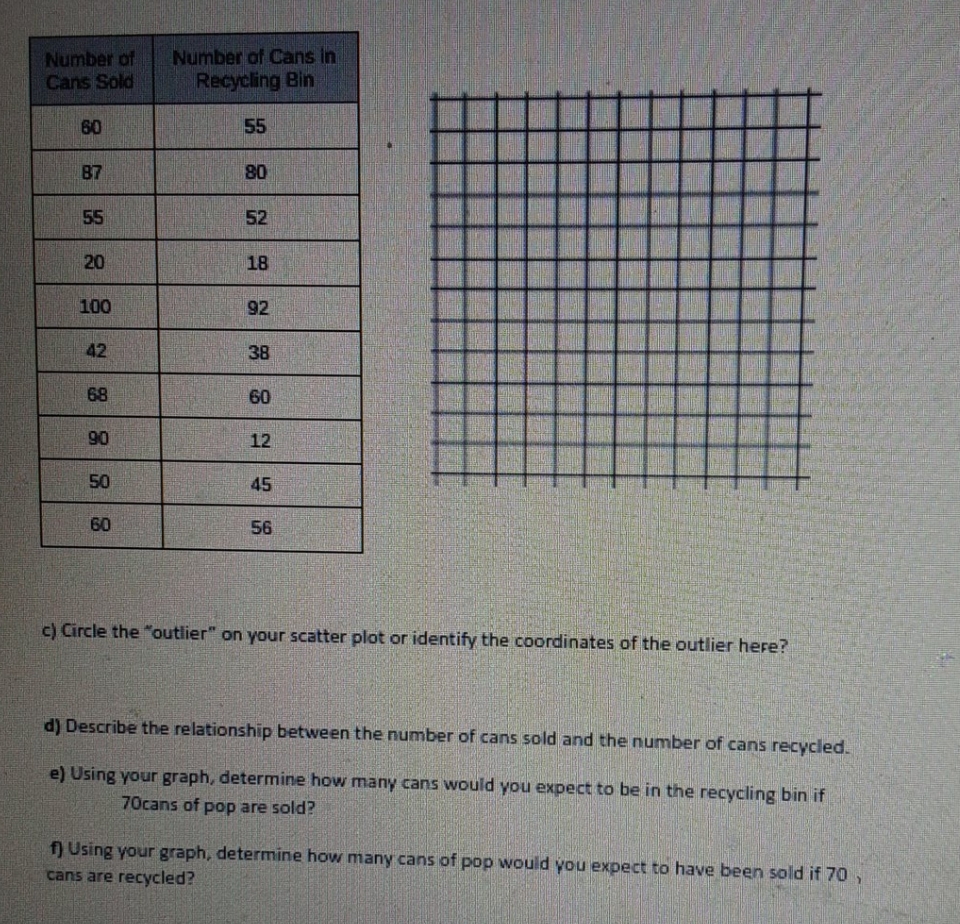
Number of Number of Cans in Cans Sold Recycling Bin 60 55 87 80 55 52 20 18 100 92 42 38 68 60 90 12 50 45 60 56 c) Circle the "outlier" on your scatter plot or identify the coordinates of the outlier here? d) Describe the relationship between the number of cans sold and the number of cans recycled. e) Using your graph, determine how many cans would you expect to be in the recycling bin if 70cans of pop are sold? f) Using your graph, determine how many cans of pop would you expect to have been sold if 70, cans are recycled
Step by Step Solution
There are 3 Steps involved in it
1 Expert Approved Answer
Step: 1 Unlock

Question Has Been Solved by an Expert!
Get step-by-step solutions from verified subject matter experts
Step: 2 Unlock
Step: 3 Unlock