Question: Can you provide guidelines step by step with all calculations please (Excel). Picture 1, 2 & 3 - Are the instructions. Picture 4 - Questions
Can you provide guidelines step by step with all calculations please (Excel).
Picture 1, 2 & 3 - Are the instructions.
Picture 4 - Questions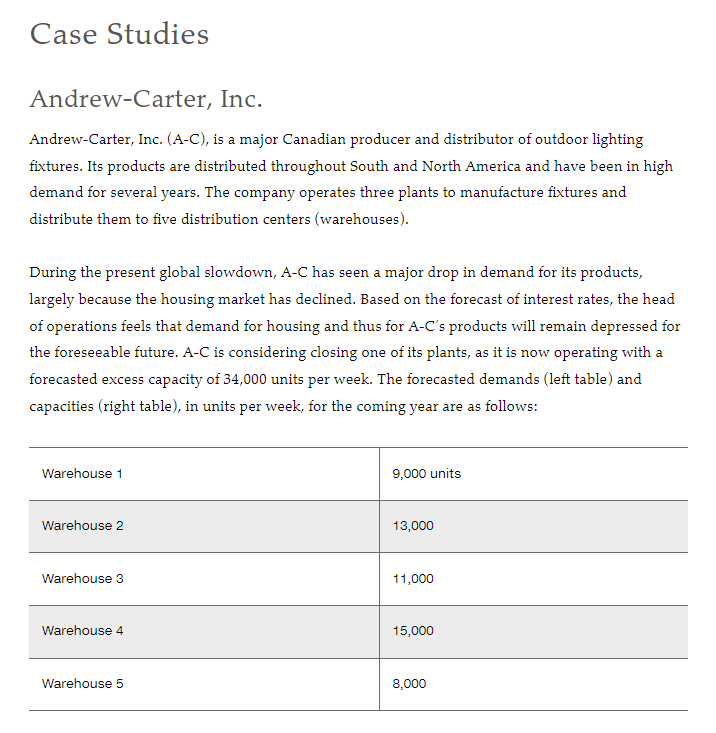
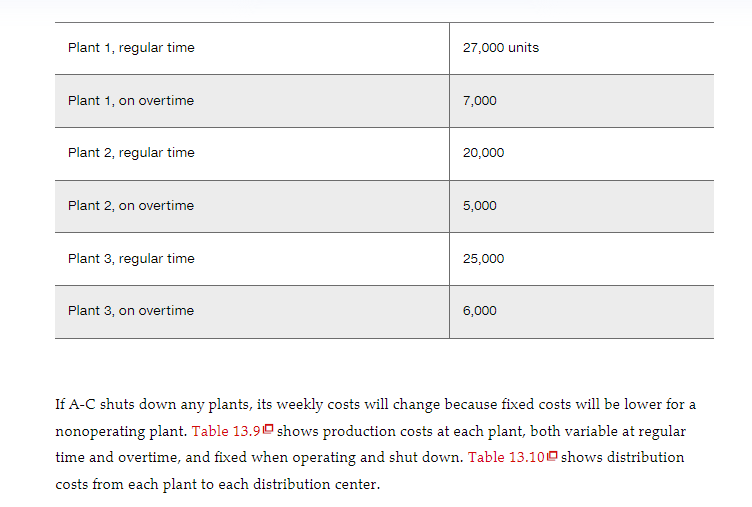
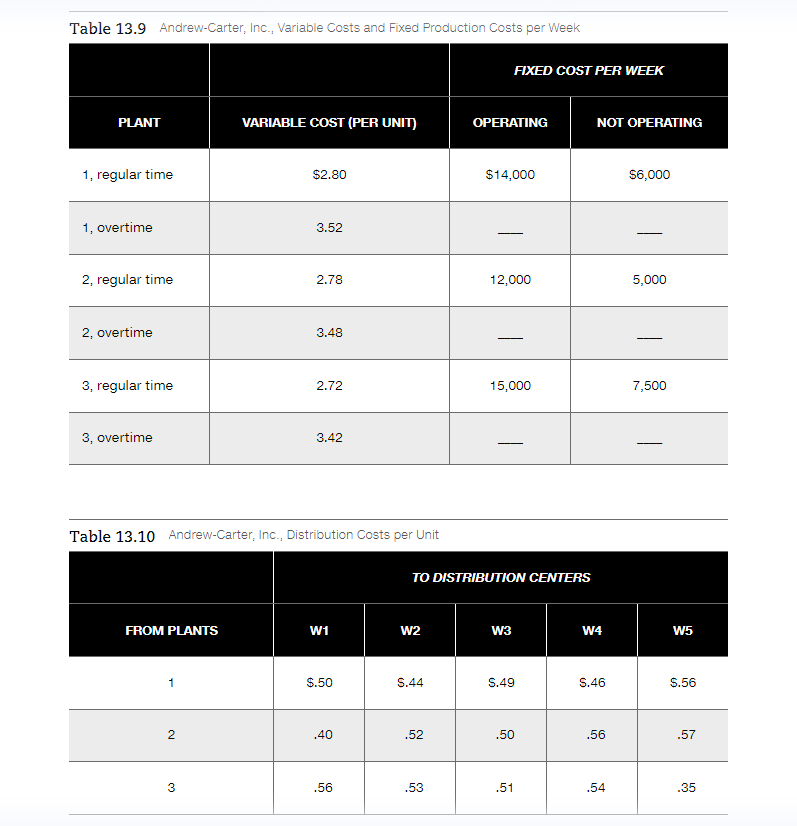
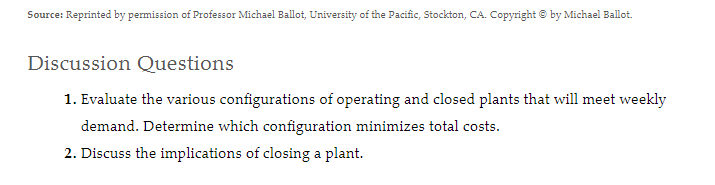
Case Studies Andrew-Carter, Inc. Andrew-Carter, Inc. (A-C), is a major Canadian producer and distributor of outdoor lighting fixtures. Its products are distributed throughout South and North America and have been in high demand for several years. The company operates three plants to manufacture fixtures and distribute them to five distribution centers (warehouses). During the present global slowdown, A-C has seen a major drop in demand for its products, largely because the housing market has declined. Based on the forecast of interest rates, the head of operations feels that demand for housing and thus for A-C's products will remain depressed for the foreseeable future. A-C is considering closing one of its plants, as it is now operating with a forecasted excess capacity of 34,000 units per week. The forecasted demands (left table) and capacities (right table), in units per week, for the coming year are as follows: Warehouse 1 Warehouse 2 Warehouse 3 Warehouse 4 Warehouse 5 9,000 units 13,000 11,000 15,000 8,000 Plant 1, regular time Plant 1, on overtime Plant 2, regular time Plant 2, on overtime Plant 3, regular time Plant 3, on overtime 27,000 units 7,000 20,000 5,000 25,000 6,000 If A-C shuts down any plants, its weekly costs will change because fixed costs will be lower for a nonoperating plant. Table 13.90 shows production costs at each plant, both variable at regular time and overtime, and fixed when operating and shut down. Table 13.100 shows distribution costs from each plant to each distribution center. Table 13.9 Andrew-Carter, Inc., Variable Costs and Fixed Production Costs per Week PLANT 1, regular time 1, overtime 2, regular time 2, overtime 3, regular time 3, overtime FROM PLANTS 2 VARIABLE COST (PER UNIT) 3 $2.80 3.52 2.78 3.48 Table 13.10 Andrew-Carter, Inc., Distribution Costs per Unit 2.72 3.42 W1 $.50 .40 .56 W2 S.44 .52 FIXED COST PER WEEK .53 OPERATING TO DISTRIBUTION CENTERS $14,000 12,000 15,000 W3 S.49 .50 .51 NOT OPERATING W4 S.46 .56 .54 $6,000 5,000 7,500 W5 $.56 .57 .35 Source: Reprinted by permission of Professor Michael Ballot, University of the Pacific, Stockton, CA. Copyright by Michael Ballot. Discussion Questions 1. Evaluate the various configurations of operating and closed plants that will meet weekly demand. Determine which configuration minimizes total costs. 2. Discuss the implications of closing a plant


