

Question: Can you run the code shown below and display the results and plot when compiled? If there are issues running it, debug it? The answer
Can you run the code shown below and display the results and plot when compiled? If there are issues running it, debug it? The answer should be the results and plot. Thank you!
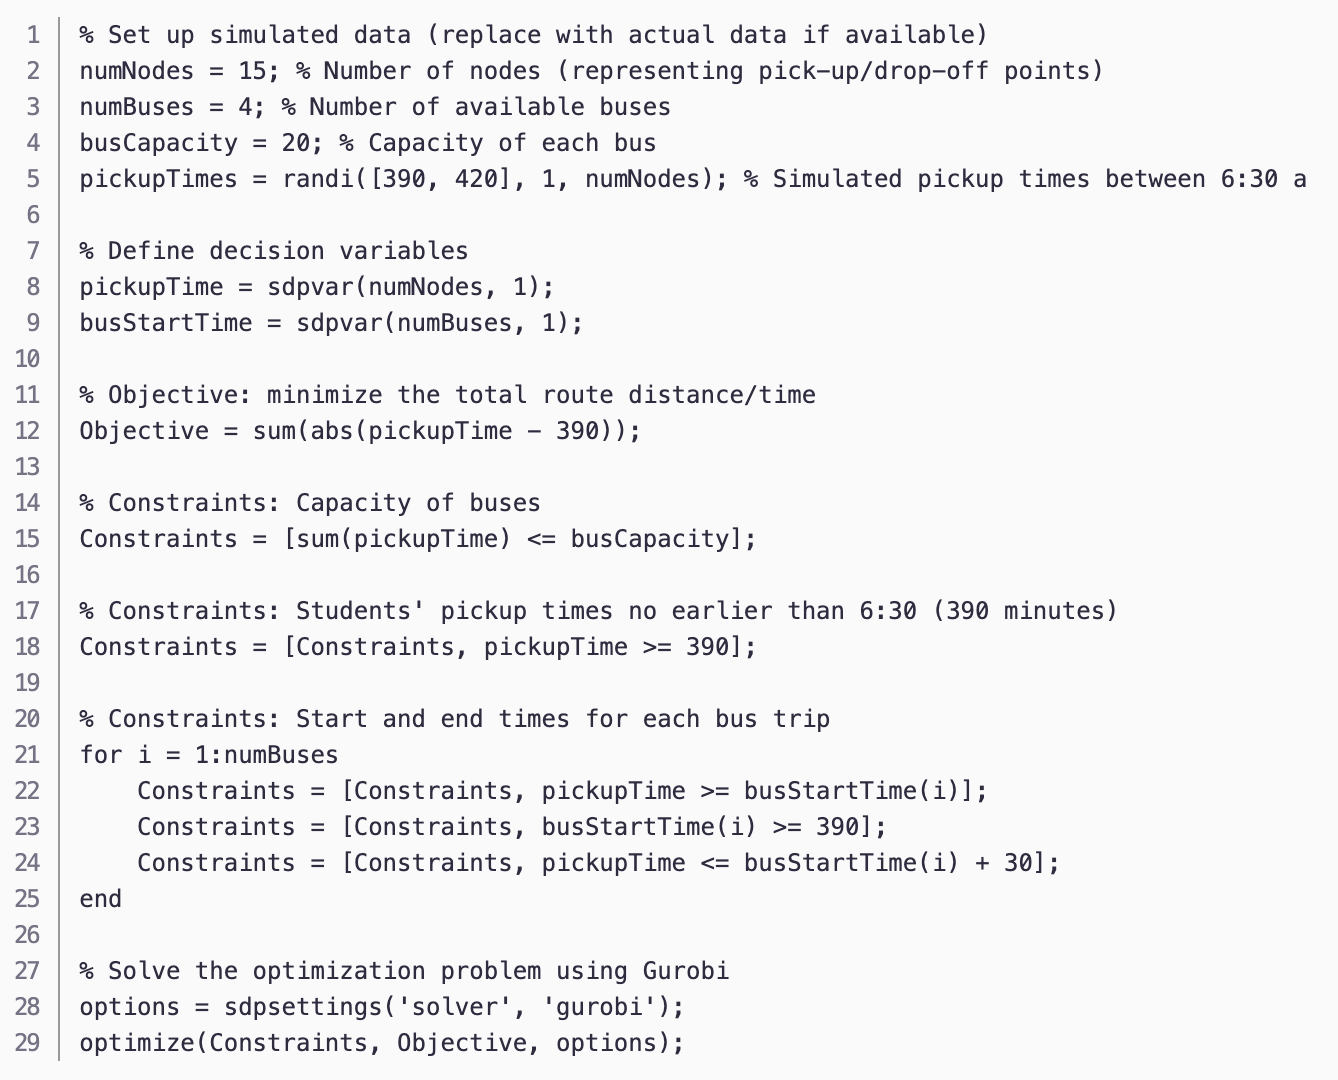
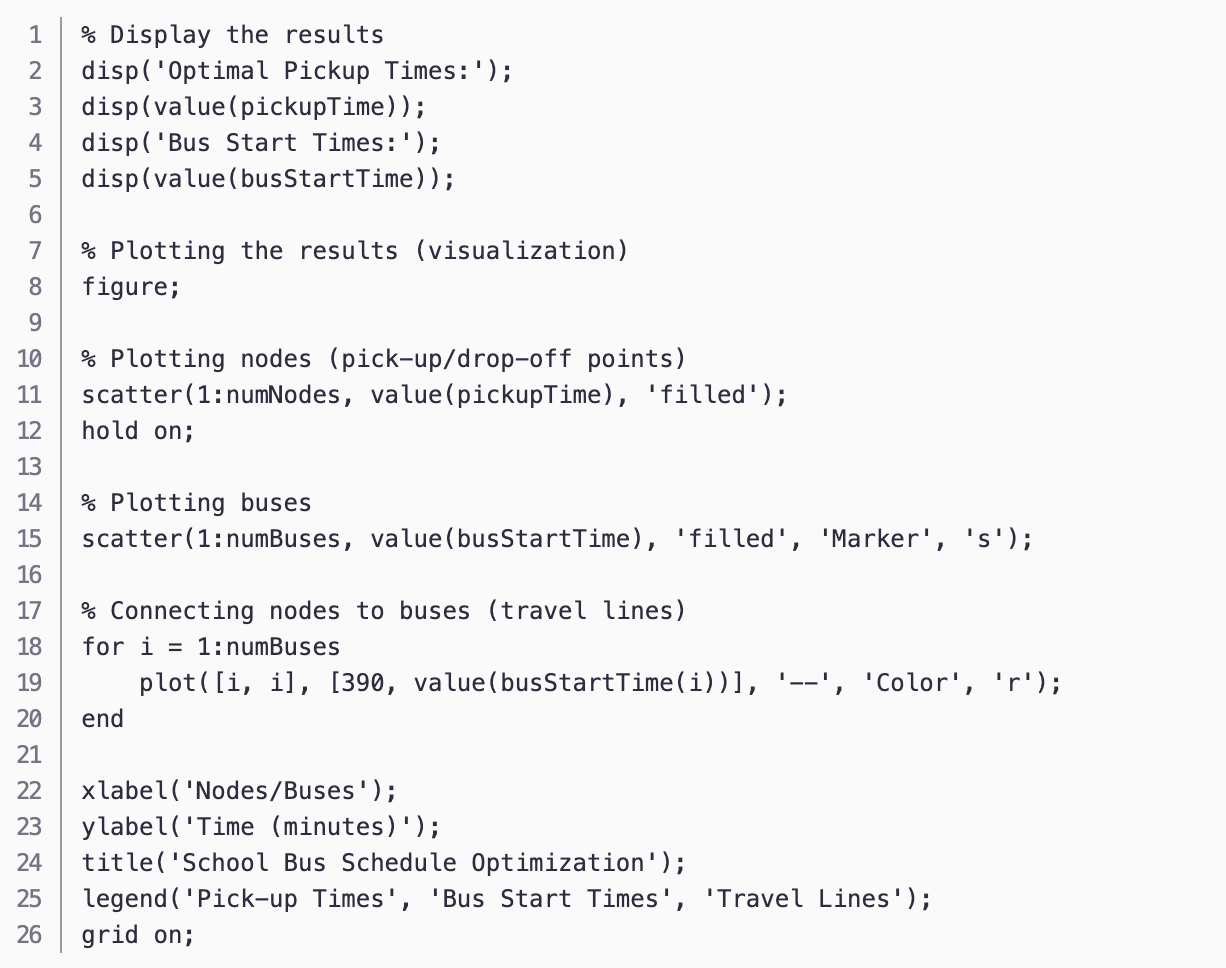
% Set up simulated data (replace with actual data if available) numNodes =15;% Number of nodes (representing pick-up/drop-off points) numBuses =4;% Number of available buses busCapacity =20; Capacity of each bus pickupTimes =randi([390,420],1, numNodes );% Simulated pickup times between 6:30 a % Define decision variables pickupTime =sdpvar( numNodes, 1); busStartTime =sdpvar( numBuses, 1); % Objective: minimize the total route distance/time Objective =sum( abs ( pickupTime -390)); % Constraints: Capacity of buses Constraints = [sum(pickupTime) = 390]; % Constraints: Start and end times for each bus trip for i=1 : numBuses Constraints = [Constraints, pickupTime >= busStartTime(i)]; Constraints = [Constraints, busStartTime(i) >= 390]; Constraints = [Constraints, pickupTime
Step by Step Solution
There are 3 Steps involved in it

Get step-by-step solutions from verified subject matter experts