

Question: can you show how to plot the graph? the last question. 5 In the linear consumption function cons = 0 + , inc, the (estimated)
can you show how to plot the graph? the last question. 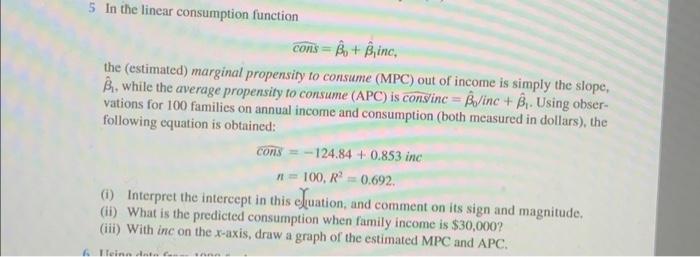
5 In the linear consumption function cons = 0 + , inc, the (estimated) marginal propensity to consume (MPC) out of income is simply the slope, B, while the average propensity to consume (APC) is cons'inc = Bo/inc + B. Using obser- vations for 100 families on annual income and consumption (both measured in dollars), the following equation is obtained: CONS = -124.84 +0.853 inc = 100, R = 0.692. (1) Interpret the intercept in this equation, and comment on its sign and magnitude, (ii) What is the predicted consumption when family income is $30,000? (iii) With inc on the x-axis, draw a graph of the estimated MPC and APC linna
Step by Step Solution
There are 3 Steps involved in it
1 Expert Approved Answer
Step: 1 Unlock

Question Has Been Solved by an Expert!
Get step-by-step solutions from verified subject matter experts
Step: 2 Unlock
Step: 3 Unlock