

Question: can you show work if possible? i was using excel walkthrough abd kept getting it wrong Ch 3 homework 1. O Check My Work (No
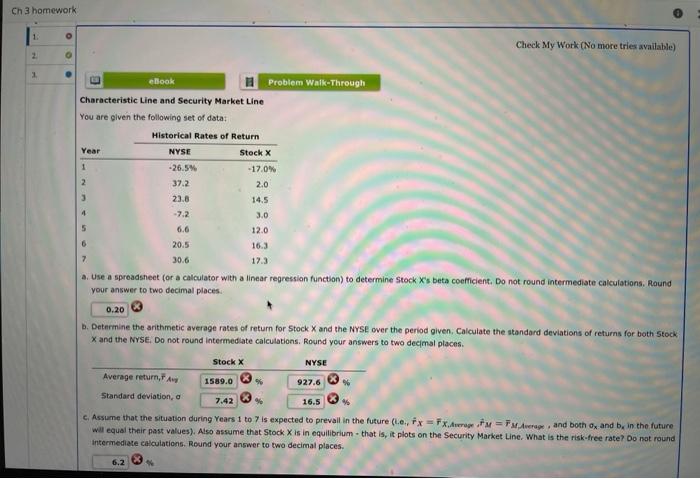
Ch 3 homework 1. O Check My Work (No more tries available) 2 1 eBook Problem Walk-Through Characteristic Line and Security Market Line You are given the following set of data: Historical Rates of Return Year NYSE Stock X 1 -26.5% -17.0% 2 37.2 2.0 3 23.8 14.5 -7.2 3.0 6.6 12.0 6 20.5 16.3 7 30.6 17.3 Use a spreadsheet (or a calculator with a linear regression function) to determine Stock X's beta coefficient. Do not round intermediate calculations. Round your answer to two decimal places 0.20 . Determine the arithmetic average rates of return for Stock X and the NYSE over the period given. Calculate the standard deviations of returns for both Stock X and the NYSE. Do not round Intermediate calculations, Round your answers to two decimal places Stock X NYSE Average return. Any 1589.0 927.6 Standard deviation, a 7.42 16.5 c. Assume that the situation during Years 1 to 7 is expected to prevall in the future (1.0, Fx = Fx Allergy FM FM Average, and both oy and be in the future will equal their past values). Also assume that Stock X is in equilibrium that is, it plots on the Security Market Line. What is the risk-free rate? Do not round Intermediate calculations. Round your answer to two decimal places. 6.2
Step by Step Solution
There are 3 Steps involved in it

Get step-by-step solutions from verified subject matter experts