

Question: Can you solve it in excel and show the steps ? calculate the deseasonal data and only explain which forecasting technique can be applied by
Can you solve it in excel and show the steps ?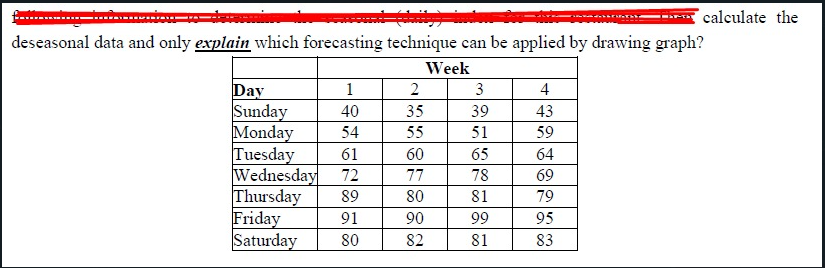
Step by Step Solution
There are 3 Steps involved in it
1 Expert Approved Answer
Step: 1 Unlock

Question Has Been Solved by an Expert!
Get step-by-step solutions from verified subject matter experts
Step: 2 Unlock
Step: 3 Unlock