

Question: can you solve the blue section and show the math please and thank you Financial statement analysis. The financial statements of Zach Industries for the
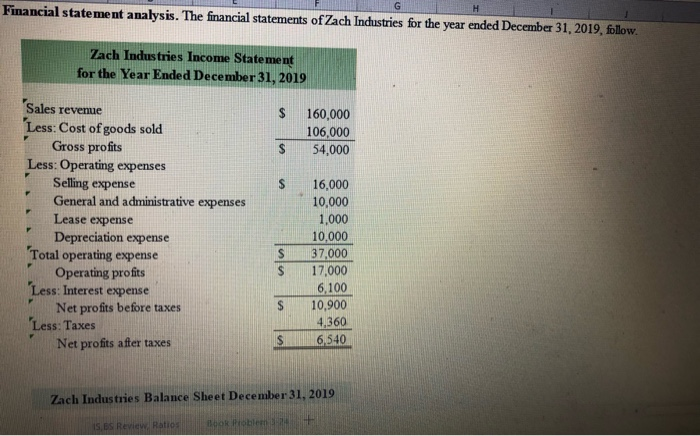
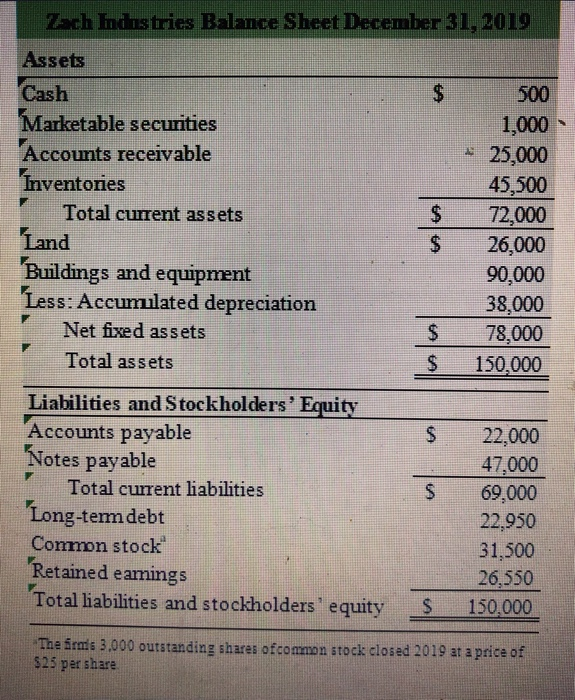
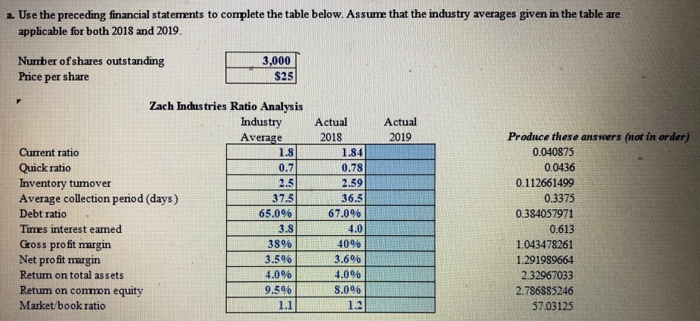
Financial statement analysis. The financial statements of Zach Industries for the year ended December 31, 2019, follow. Zach Industries Income Statement for the Year Ended December 31, 2019 $ 160,000 106,000 54,000 $ Sales revenue Less: Cost of goods sold Gross profits Less: Operating expenses Selling expense General and administrative expenses Lease expense Depreciation expense Total operating expense Operating profits Less: Interest expense Net profits before taxes Less: Taxes Net profits after taxes $ 16,000 10,000 1,000 10,000 S 37,000 17,000 6.100 10,900 4,360 S6.540 Zach Industries Balance Sheet December 31, 2019 15. Es Review Ratio Door Problema + Zach Industries Balance Sheet December 31, 2019 Assets Cash 500 Marketable securities 1,000 Accounts receivable * 25,000 Inventories 45,500 Total current assets 72,000 Land 26,000 Buildings and equipment 90,000 Less: Accumulated depreciation 38,000 Net fixed assets 78,000 Total assets $ 150,000 Liabilities and Stockholders' Equity Accounts payable Notes payable Total current liabilities 'Long-tem debt Common stock Retained eamings Total liabilities and stockholders' equity 22,000 47,000 69,000 22,950 31,500 26,550 150.000 $ The freds 3.000 outstanding shares ofcommon stock closed 2019 at a price of $25 per share Use the preceding financial statements to complete the table below. Assume that the industry averages given in the table are applicable for both 2018 and 2019. Nurnber of shares outstanding Price per share 3,000 $25 Actual 2018 Actual 2019 Zach Industries Ratio Analysis Industry Average Current ratio Quick ratio Inventory tumover Average collection period (days) Debt ratio 65.0961 Times interest earned 3.81 Gross profit margin 3896 Net profit margin Return on total assets 4,0961 Retum on common equity 9.596 Market book ratio 1.1 37.3 36.5 672006 Produce these answers (nor in order) 0.040875 0.0436 0.112661499 0.3375 0.384057971 0.613 1.043478261 1.291989664 2.32967033 2.786883246 57.03125 3.596 40% 3.696 1.096 8.096 1.2
Step by Step Solution
There are 3 Steps involved in it

Get step-by-step solutions from verified subject matter experts