

Question: Can you write a finanical analysis for this financial worksheet including analysis liquidity (including risk), capital structure (including cost of capital), performance, activity, and limits
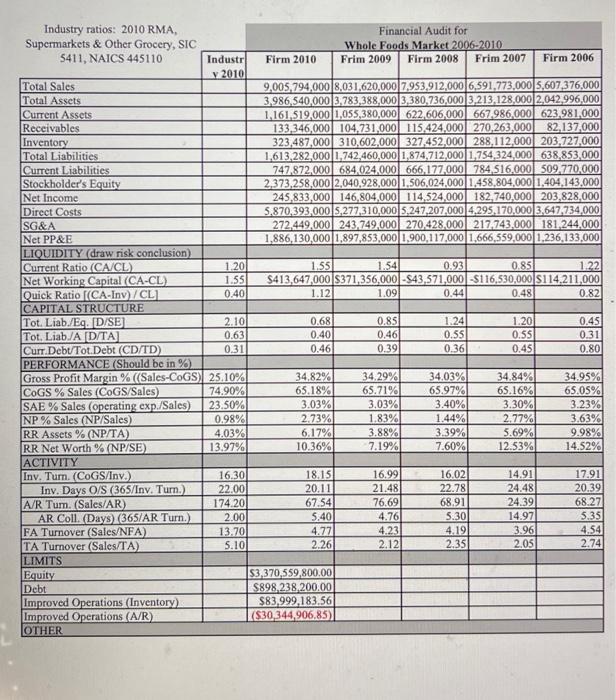
\begin{tabular}{|c|c|c|c|c|c|c|} \hline \multirow{2}{*}{\begin{tabular}{l} Industry ratios: 2010 RMA, \\ Supermarkets \& Other Grocery, SIC \\ 5411 , NAICS 445110 \end{tabular}} & & \multicolumn{5}{|c|}{\begin{tabular}{l} Financial Audit for \\ hole Foods Market 200 \end{tabular}} \\ \hline & \begin{tabular}{|r|} Industr \\ v 2010 \\ \end{tabular} & Firm 2010 & Frim 2009 & Firm 2008 & Frim 2007 & Firm 2006 \\ \hline Total Sales & & 9,005,794,000 & \begin{tabular}{|l|l|} 8,031,620,000 & 7 \\ \end{tabular} & 7,953,912,000 & 6,591,773,000 & 5,607,376,000 \\ \hline Total Assets & & 3,986,540,000 & \begin{tabular}{|l|l|} 3,783,388,000 & 3 \\ \end{tabular} & 3,380,736,000 & 3,213,128,000 & 2,042,996,000 \\ \hline Current Assets & & 1,161,519,000 & 1,055,380,000 & 622,606,000 & 667,986,000 & 623,981,000 \\ \hline Receivables & & 133,346,000 & \begin{tabular}{|c|} 104,731,000 \\ \end{tabular} & 115,424,000 & 270,263,000 & 82,137,000 \\ \hline \begin{tabular}{|l|l|} Inventory \\ \end{tabular} & & 323,487,000 & \begin{tabular}{|c|} 310,602,000 \\ \end{tabular} & 327,452,000 & 288,112,000 & 203,727,000 \\ \hline \begin{tabular}{|c|} Total Liabilities \\ \end{tabular} & & 1,613,282,000 & \begin{tabular}{|l|l|} 1,742,460,000 & 1 \\ \end{tabular} & 1,874,712,000 & 1,754,324,000 & 638,853,000 \\ \hline Current Liabilities & & 747,872,000 & 684,024,000 & 666,177,000 & 784,516,000 & 509,770,000 \\ \hline Stockholder's Equity & & 2,373,258,000 & \begin{tabular}{|l|l|} 2,040,928,000 \\ \end{tabular} & 1,506,024,000 & \begin{tabular}{|l|l|} 1,458,804,000 \\ \end{tabular} & 1,404,143,000 \\ \hline Net Income & & 245,833,000 & \begin{tabular}{|l|l|} 146,804,000 \\ \end{tabular} & \begin{tabular}{|l|} 114,524,000 \\ \end{tabular} & 182,740,000 & 203,828,000 \\ \hline Direct Costs & & 5,870,393,000 & 5,277,310,0005 & 5,247,207,000 & \begin{tabular}{|c|c|} 4,295,170,000 \\ \end{tabular} & 3,647,734,000 \\ \hline SG\&A & & 272,449,000 & 243,749,000 & 270,428,000 & \begin{tabular}{|c|} 217,743,000 \\ \end{tabular} & 181,244,000 \\ \hline Net PP\&E & & 1,886,130,000 & 1,897,853,000 & 1,900,117,000 & 1,666,559,000 & 1,236,133,000 \\ \hline \multicolumn{7}{|l|}{ LIQUIDITY (draw risk conclusion) } \\ \hline Current Ratio (CA/CL) & 1.20 & 1.55 & 1.54 & 0.93 & 0.85 & 1.22 \\ \hline Net Working Capital (CA-CL) & 1.55 & $413,647,000 & $371,356,000 & $43,571,000 & $116,530,000 & $114,211,000 \\ \hline Quick Ratio [(CA-Inv)/CL] & 0.40 & 1.12 & 1.09 & 0.44 & 0.48 & 0.82 \\ \hline \multicolumn{7}{|l|}{ CAPITAL STRUCTURE } \\ \hline Tot. Liab./Eg. [D/SE] & 2.10 & 0.68 & 0.85 & 1.24 & 1.20 & 0.45 \\ \hline Tot. Liab/A [D/TA] & 0.63 & 0.40 & 0.46 & 0.55 & 0.55 & 0.31 \\ \hline Curr.Debt/Tot.Debt (CD/TD) & 0.31 & 0.46 & 0.39 & 0.36 & 0.45 & 0.80 \\ \hline \multicolumn{7}{|l|}{ PERFORMANCE (Should be in \%) } \\ \hline Gross Profit Margin \% ((Sales-CoGS) & 25.10% & 34,82% & 34.29% & 34.03% & 34.84% & 34.95% \\ \hline CoGS \% Sales (CoGS/Sales) & 74.90% & 65.18% & 65.71% & 65.97% & 65.16% & 65.05% \\ \hline SAE \% Sales (operating exp./Sales) & 23.50% & 3.03% & 3.03% & 3.40% & 3.30% & 3.23% \\ \hline NP \% Sales (NP/Sales) & 0.98% & 2.73% & 1.83% & 1.44% & 2.77% & 3.63% \\ \hline RR Assets \% (NP/TA) & 4.03% & 6.17% & 3.88% & 3.39% & 5.69% & 9.98% \\ \hline RR Net Worth \% (NP/SE) & 13.97% & 10.36% & 7.19% & 7.60% & 12.53% & 14.52% \\ \hline \multicolumn{7}{|l|}{\begin{tabular}{|l|l|} ACTIVITY \\ \end{tabular}} \\ \hline Inv. Tum. (CoGS/Inv.) & 16.30 & 18.15 & 16.99 & 16.02 & 14.91 & 17.91 \\ \hline Inv. Days O/S (365/Inv. Tum.) & 22.00 & 20.11 & 21.48 & 22.78 & 24.48 & 20.39 \\ \hline A/R Tum. (Sales/AR) & 174.20 & 67.54 & 76,69 & 68.91 & 24.39 & 68.27 \\ \hline AR Coll. (Days) (365/AR Turn.) & 2.00 & 5.40 & 4.76 & 5.30 & 14.97 & 5.35 \\ \hline FA Tumover (Sales/NFA) & 13.70 & 4.77 & 4.23 & 4.19 & 3.96 & 4.54 \\ \hline TA Turnover (Sales/TA) & 5.10 & 2.26 & 2.12 & 2.35 & 2.05 & 2.74 \\ \hline \multicolumn{7}{|l|}{\begin{tabular}{l} LIMITS \\ \end{tabular}} \\ \hline Equity & & $3,370,559,800,00 & & & & \\ \hline Debt & & $898,238,200.00 & & & & \\ \hline Improved Operations (Inventory) & & $83,999,183.56 & & & & \\ \hline Improved Operations (A/R) & - & ($30,344,906.85) & & & & \\ \hline \end{tabular} \begin{tabular}{|c|c|c|c|c|c|c|} \hline \multirow{2}{*}{\begin{tabular}{l} Industry ratios: 2010 RMA, \\ Supermarkets \& Other Grocery, SIC \\ 5411 , NAICS 445110 \end{tabular}} & & \multicolumn{5}{|c|}{\begin{tabular}{l} Financial Audit for \\ hole Foods Market 200 \end{tabular}} \\ \hline & \begin{tabular}{|r|} Industr \\ v 2010 \\ \end{tabular} & Firm 2010 & Frim 2009 & Firm 2008 & Frim 2007 & Firm 2006 \\ \hline Total Sales & & 9,005,794,000 & \begin{tabular}{|l|l|} 8,031,620,000 & 7 \\ \end{tabular} & 7,953,912,000 & 6,591,773,000 & 5,607,376,000 \\ \hline Total Assets & & 3,986,540,000 & \begin{tabular}{|l|l|} 3,783,388,000 & 3 \\ \end{tabular} & 3,380,736,000 & 3,213,128,000 & 2,042,996,000 \\ \hline Current Assets & & 1,161,519,000 & 1,055,380,000 & 622,606,000 & 667,986,000 & 623,981,000 \\ \hline Receivables & & 133,346,000 & \begin{tabular}{|c|} 104,731,000 \\ \end{tabular} & 115,424,000 & 270,263,000 & 82,137,000 \\ \hline \begin{tabular}{|l|l|} Inventory \\ \end{tabular} & & 323,487,000 & \begin{tabular}{|c|} 310,602,000 \\ \end{tabular} & 327,452,000 & 288,112,000 & 203,727,000 \\ \hline \begin{tabular}{|c|} Total Liabilities \\ \end{tabular} & & 1,613,282,000 & \begin{tabular}{|l|l|} 1,742,460,000 & 1 \\ \end{tabular} & 1,874,712,000 & 1,754,324,000 & 638,853,000 \\ \hline Current Liabilities & & 747,872,000 & 684,024,000 & 666,177,000 & 784,516,000 & 509,770,000 \\ \hline Stockholder's Equity & & 2,373,258,000 & \begin{tabular}{|l|l|} 2,040,928,000 \\ \end{tabular} & 1,506,024,000 & \begin{tabular}{|l|l|} 1,458,804,000 \\ \end{tabular} & 1,404,143,000 \\ \hline Net Income & & 245,833,000 & \begin{tabular}{|l|l|} 146,804,000 \\ \end{tabular} & \begin{tabular}{|l|} 114,524,000 \\ \end{tabular} & 182,740,000 & 203,828,000 \\ \hline Direct Costs & & 5,870,393,000 & 5,277,310,0005 & 5,247,207,000 & \begin{tabular}{|c|c|} 4,295,170,000 \\ \end{tabular} & 3,647,734,000 \\ \hline SG\&A & & 272,449,000 & 243,749,000 & 270,428,000 & \begin{tabular}{|c|} 217,743,000 \\ \end{tabular} & 181,244,000 \\ \hline Net PP\&E & & 1,886,130,000 & 1,897,853,000 & 1,900,117,000 & 1,666,559,000 & 1,236,133,000 \\ \hline \multicolumn{7}{|l|}{ LIQUIDITY (draw risk conclusion) } \\ \hline Current Ratio (CA/CL) & 1.20 & 1.55 & 1.54 & 0.93 & 0.85 & 1.22 \\ \hline Net Working Capital (CA-CL) & 1.55 & $413,647,000 & $371,356,000 & $43,571,000 & $116,530,000 & $114,211,000 \\ \hline Quick Ratio [(CA-Inv)/CL] & 0.40 & 1.12 & 1.09 & 0.44 & 0.48 & 0.82 \\ \hline \multicolumn{7}{|l|}{ CAPITAL STRUCTURE } \\ \hline Tot. Liab./Eg. [D/SE] & 2.10 & 0.68 & 0.85 & 1.24 & 1.20 & 0.45 \\ \hline Tot. Liab/A [D/TA] & 0.63 & 0.40 & 0.46 & 0.55 & 0.55 & 0.31 \\ \hline Curr.Debt/Tot.Debt (CD/TD) & 0.31 & 0.46 & 0.39 & 0.36 & 0.45 & 0.80 \\ \hline \multicolumn{7}{|l|}{ PERFORMANCE (Should be in \%) } \\ \hline Gross Profit Margin \% ((Sales-CoGS) & 25.10% & 34,82% & 34.29% & 34.03% & 34.84% & 34.95% \\ \hline CoGS \% Sales (CoGS/Sales) & 74.90% & 65.18% & 65.71% & 65.97% & 65.16% & 65.05% \\ \hline SAE \% Sales (operating exp./Sales) & 23.50% & 3.03% & 3.03% & 3.40% & 3.30% & 3.23% \\ \hline NP \% Sales (NP/Sales) & 0.98% & 2.73% & 1.83% & 1.44% & 2.77% & 3.63% \\ \hline RR Assets \% (NP/TA) & 4.03% & 6.17% & 3.88% & 3.39% & 5.69% & 9.98% \\ \hline RR Net Worth \% (NP/SE) & 13.97% & 10.36% & 7.19% & 7.60% & 12.53% & 14.52% \\ \hline \multicolumn{7}{|l|}{\begin{tabular}{|l|l|} ACTIVITY \\ \end{tabular}} \\ \hline Inv. Tum. (CoGS/Inv.) & 16.30 & 18.15 & 16.99 & 16.02 & 14.91 & 17.91 \\ \hline Inv. Days O/S (365/Inv. Tum.) & 22.00 & 20.11 & 21.48 & 22.78 & 24.48 & 20.39 \\ \hline A/R Tum. (Sales/AR) & 174.20 & 67.54 & 76,69 & 68.91 & 24.39 & 68.27 \\ \hline AR Coll. (Days) (365/AR Turn.) & 2.00 & 5.40 & 4.76 & 5.30 & 14.97 & 5.35 \\ \hline FA Tumover (Sales/NFA) & 13.70 & 4.77 & 4.23 & 4.19 & 3.96 & 4.54 \\ \hline TA Turnover (Sales/TA) & 5.10 & 2.26 & 2.12 & 2.35 & 2.05 & 2.74 \\ \hline \multicolumn{7}{|l|}{\begin{tabular}{l} LIMITS \\ \end{tabular}} \\ \hline Equity & & $3,370,559,800,00 & & & & \\ \hline Debt & & $898,238,200.00 & & & & \\ \hline Improved Operations (Inventory) & & $83,999,183.56 & & & & \\ \hline Improved Operations (A/R) & - & ($30,344,906.85) & & & & \\ \hline \end{tabular}
Step by Step Solution
There are 3 Steps involved in it

Get step-by-step solutions from verified subject matter experts