

Question: Cannot figure this out. please help me out (1 point) Conside the following data set. Sample1 61 71 61 81 31 91 81 Sample2 41
Cannot figure this out. please help me out
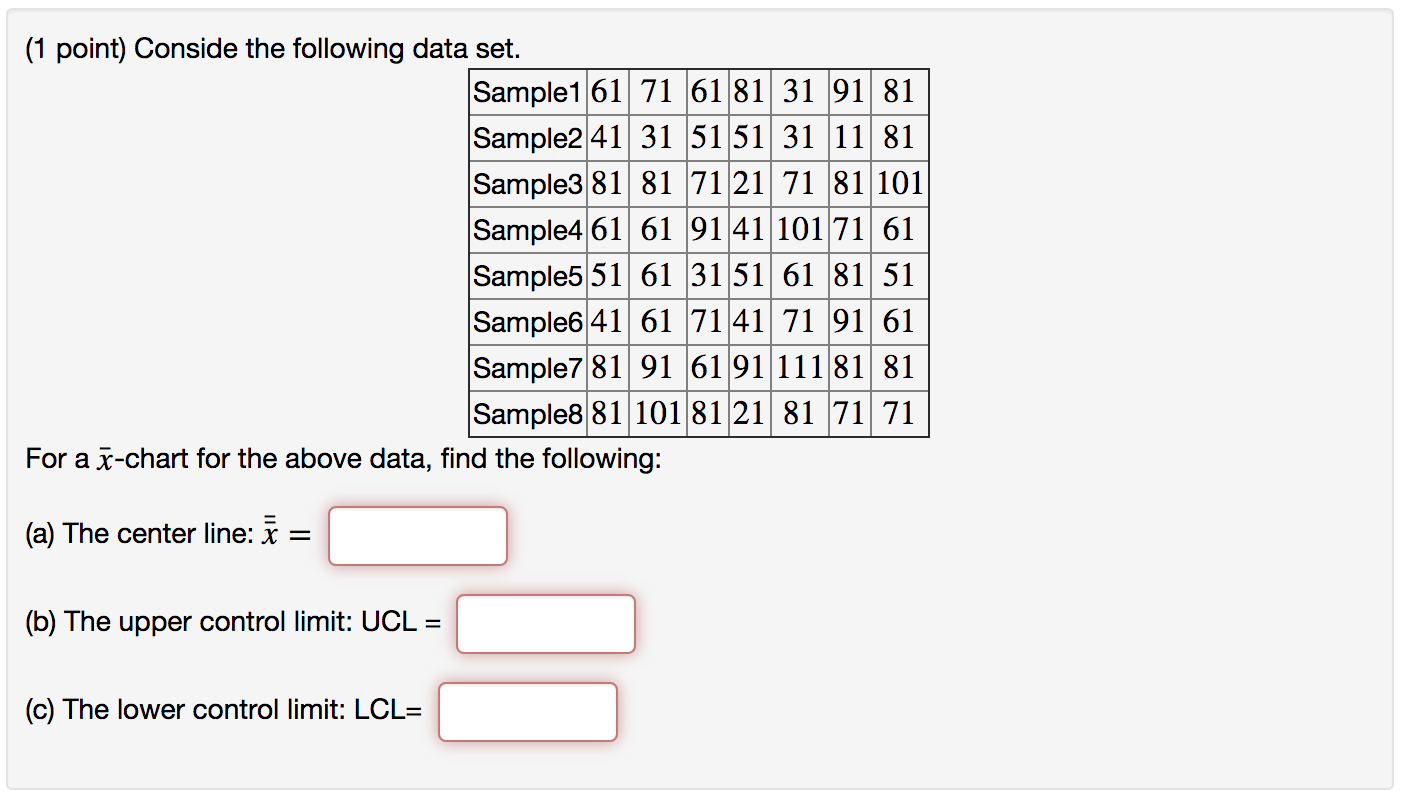
(1 point) Conside the following data set. Sample1 61 71 61 81 31 91 81 Sample2 41 31 51 51 31 11 81 Sample3 81 81 71 21 71 81 101 Sample4 61 61 91 41 101 71 61 Sample5 51 61 31 51 61 81 51 Sample6 41 61 71 41 71 91 61 Sample7 81 91 61 91 111 81 81 Sample8 81 101 81 21 81 71 71 For a x-chart for the above data, find the following: (a) The center line: x = (b) The upper control limit: UCL = (c) The lower control limit: LCL=
Step by Step Solution
There are 3 Steps involved in it
1 Expert Approved Answer
Step: 1 Unlock

Question Has Been Solved by an Expert!
Get step-by-step solutions from verified subject matter experts
Step: 2 Unlock
Step: 3 Unlock