

Question: Cannot seem to figure this entire problem out. Please help solve and show work and steps! Franklin Tooling, Inc., manufactures specialty tooling for firms in
Cannot seem to figure this entire problem out. Please help solve and show work and steps!
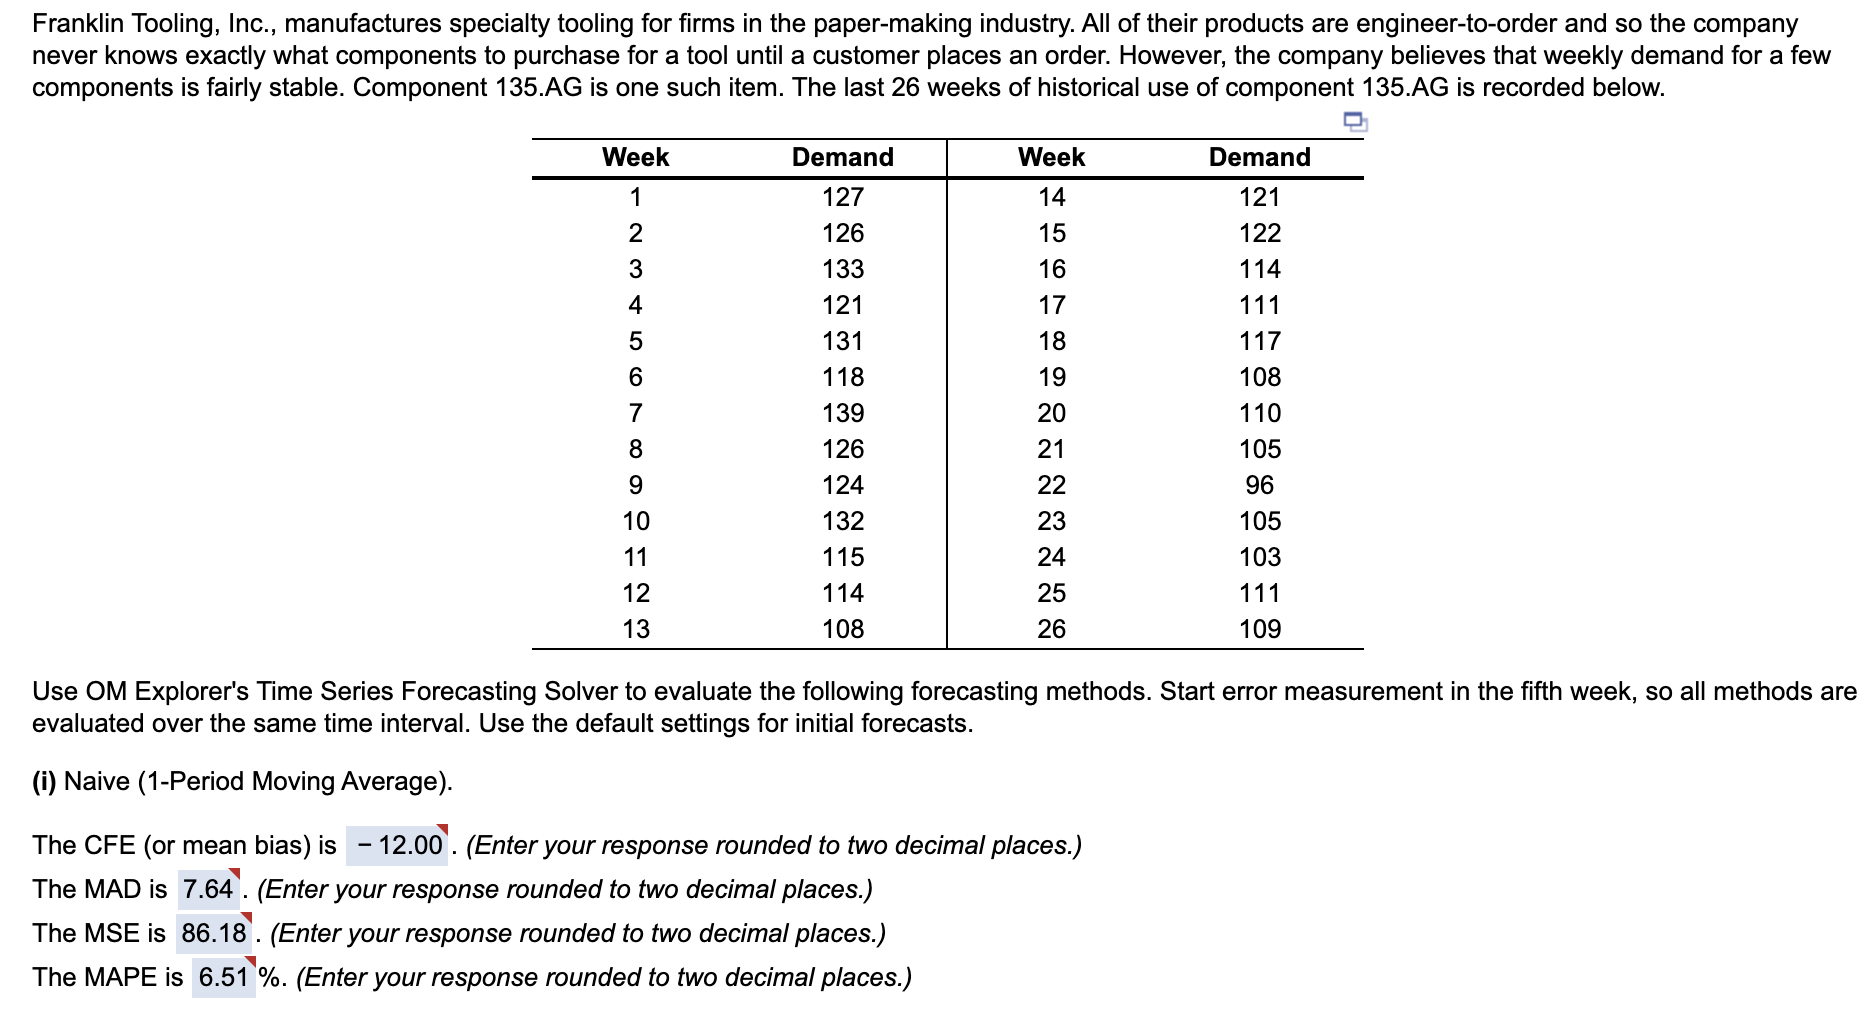
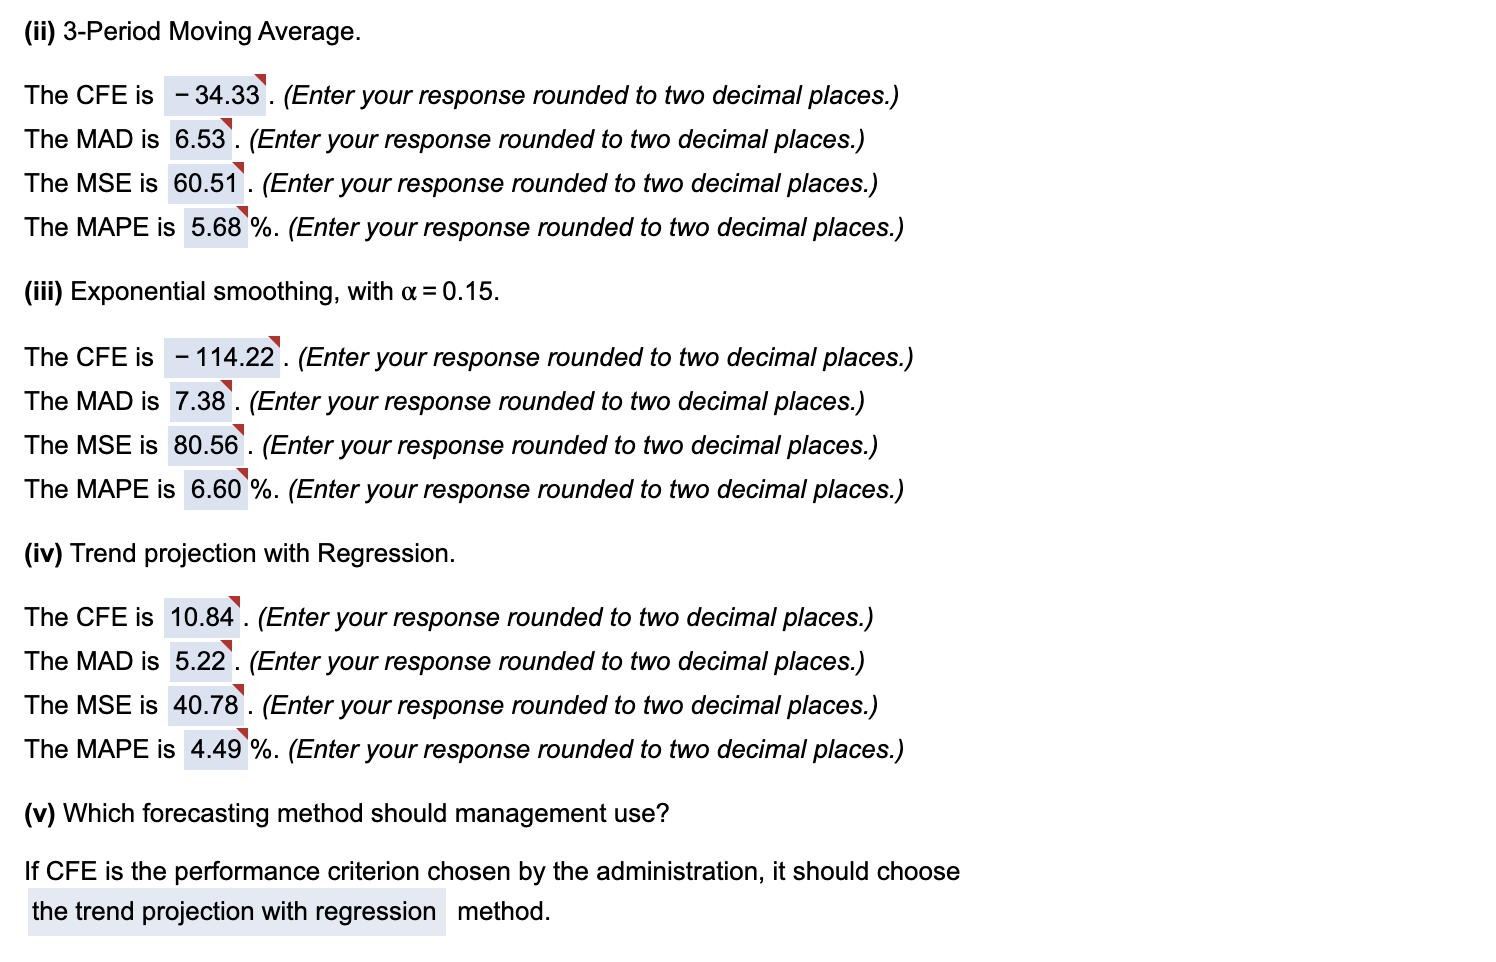
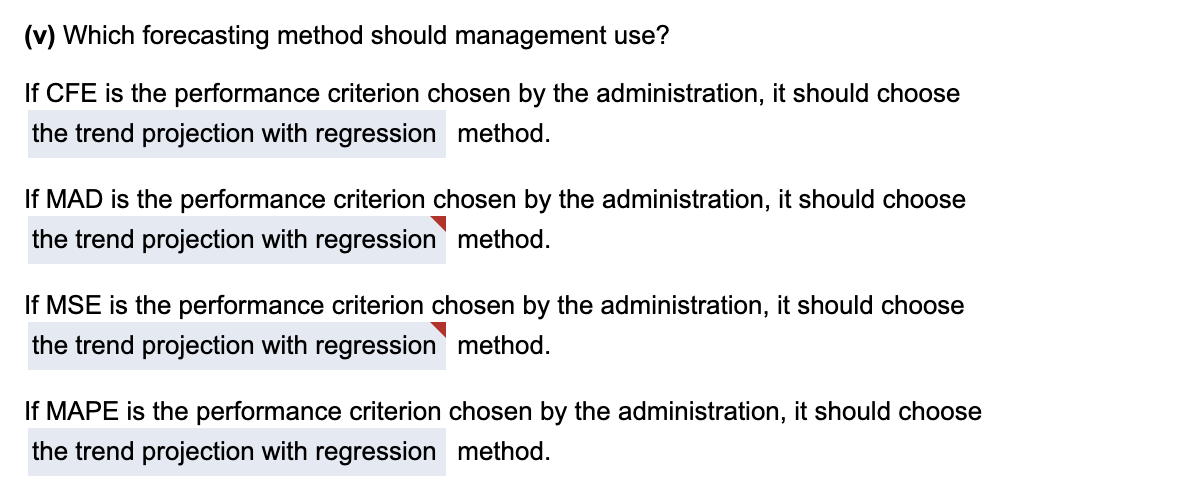
Franklin Tooling, Inc., manufactures specialty tooling for firms in the paper-making industry. All of their products are engineer-to-order and so the company never knows exactly what components to purchase for a tool until a customer places an order. However, the company believes that weekly demand for a few components is fairly stable. Component 135.AG is one such item. The last 26 weeks of historical use of component 135.AG is recorded below. Week Demand Week Demand 1 2 3 4 5 6 127 126 133 121 131 118 139 126 124 132 115 114 108 14 15 16 17 18 19 20 21 22 23 121 122 114 111 117 108 110 105 7 8 9 10 11 12 13 96 24 105 103 111 109 25 26 Use OM Explorer's Time Series Forecasting Solver to evaluate the following forecasting methods. Start error measurement in the fifth week, so all methods are evaluated over the same time interval. Use the default settings for initial forecasts. (i) Naive (1-Period Moving Average). - The CFE (or mean bias) is 12.00. (Enter your response rounded to two decimal places.) The MAD is 7.64. (Enter your response rounded to two decimal places.) The MSE is 86.18. (Enter your response rounded to two decimal places.) The MAPE is 6.51 %. (Enter your response rounded to two decimal places.) (ii) 3-Period Moving Average. The CFE is - 34.33. (Enter your response rounded to two decimal places.) The MAD is 6.53. (Enter your response rounded to two decimal places.) The MSE is 60.51. (Enter your response rounded to two decimal places.) The MAPE is 5.68 %. (Enter your response rounded to two decimal places.) (iii) Exponential smoothing, with a = 0.15. The CFE is - 114.22. (Enter your response rounded to two decimal places.) The MAD is 7.38. (Enter your response rounded to two decimal places.) The MSE is 80.56. (Enter your response rounded to two decimal places.) The MAPE is 6.60 %. (Enter your response rounded to two decimal places.) (iv) Trend projection with Regression. The CFE is 10.84. (Enter your response rounded to two decimal places.) The MAD is 5.22. (Enter your response rounded to two decimal places.) The MSE is 40.78 . (Enter your response rounded to two decimal places.) The MAPE is 4.49 %. (Enter your response rounded to two decimal places.) (v) Which forecasting method should management use? If CFE is the performance criterion chosen by the administration, it should choose the trend projection with regression method. (v) Which forecasting method should management use? If CFE is the performance criterion chosen by the administration, it should choose the trend projection with regression method. If MAD is the performance criterion chosen by the administration, it should choose the trend projection with regression method. If MSE is the performance criterion chosen by the administration, it should choose the trend projection with regression method. If MAPE is the performance criterion chosen by the administration, it should choose the trend projection with regression methodStep by Step Solution
There are 3 Steps involved in it
1 Expert Approved Answer
Step: 1 Unlock

Question Has Been Solved by an Expert!
Get step-by-step solutions from verified subject matter experts
Step: 2 Unlock
Step: 3 Unlock