

Question: cant understand 12 The box plot below summarises the 002 emissions, in gfkm, for cars in the Large Data Set from the London and North
cant understand
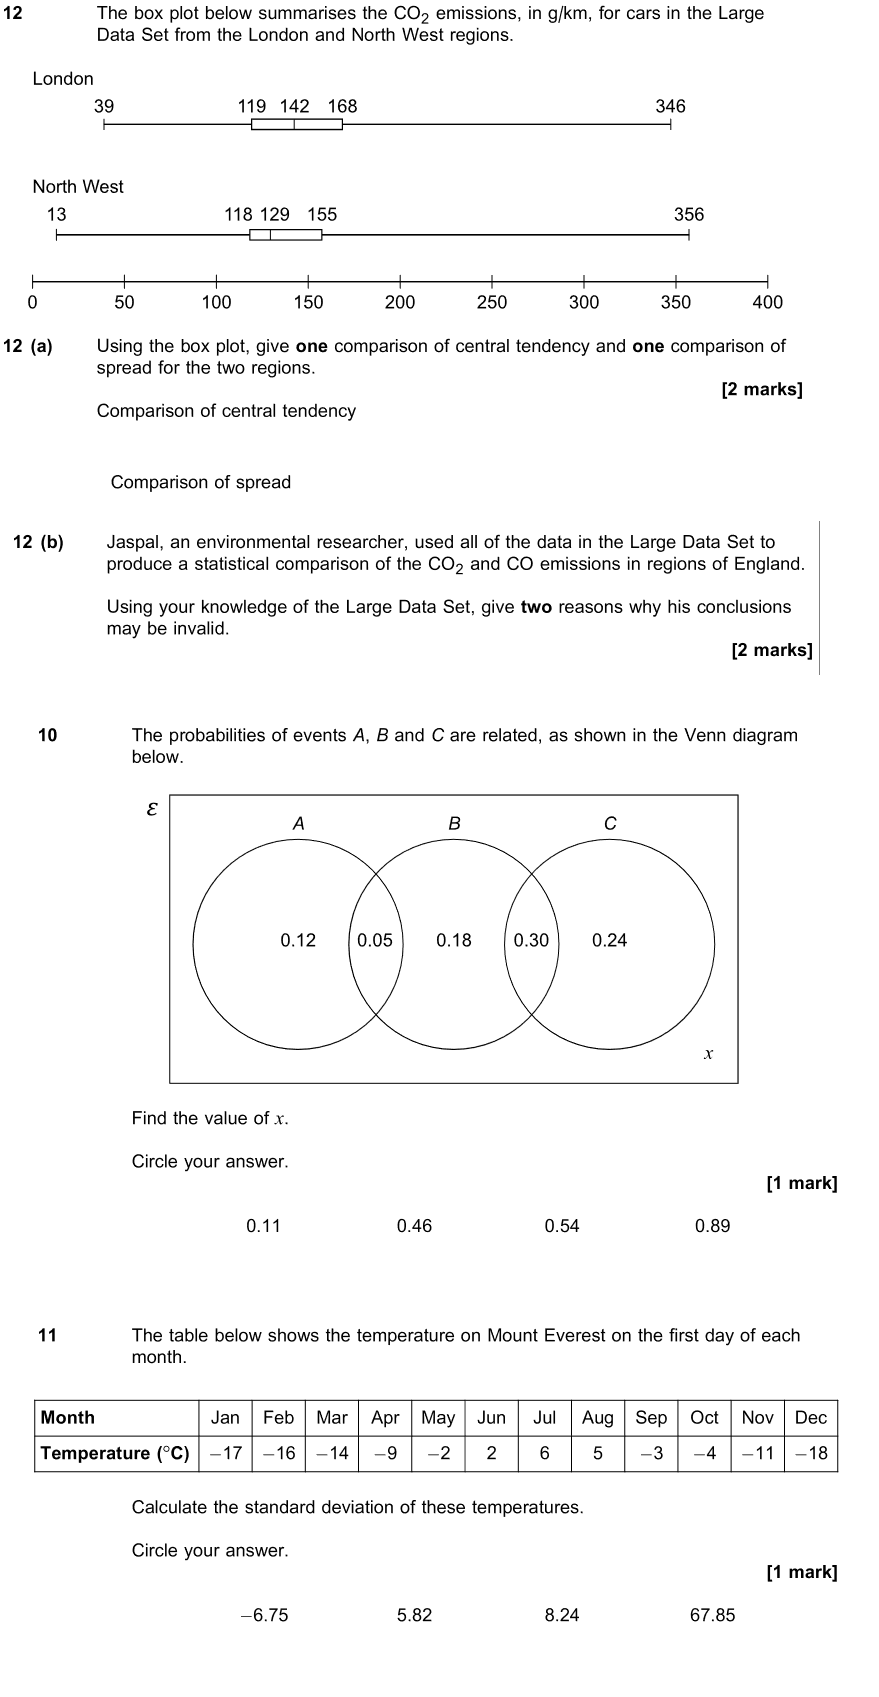
12 The box plot below summarises the 002 emissions, in gfkm, for cars in the Large Data Set from the London and North West regions. London 39 119 142 168 346 ii:i:ii North West 13 118129 155 356 lElZIl lllllllll 0 50 100 150 200 250 300 350 400 12 (a) Using the box plot, give one comparison of central tendency and one comparison of spread for the two regions. [2 marks] Comparison of central tendency Comparison of spread 12 (b) Jaspal, an environmental researcher, used all of the data in the Large Data Set to produce a statistical comparison of the 002 and CO emissions in regions of England. Using your knowledge of the Large Data Set, give two reasons why his conclusions may be invalid. [2 marks] 10 The probabilities of events A. B and C are related, as shown in the Venn diagram below. Find the value of x. Circle your answer. [1 mark] 0.11 0.46 0.54 0.89 11 The table below shows the temperature on Mount Everest on the rst day of each month. Month Feb Mar Apr May Jun Aug Sep Oct Nov Dec mmmnmmna-nnannm Calculate the standard deviation of these temperatures. Circle your answer. [1 mark] 5.75 5.82 8.24 67.65
Step by Step Solution
There are 3 Steps involved in it

Get step-by-step solutions from verified subject matter experts